Juvenile? Absolutely, but hopefully one or more of these will give you a smile this morning 🙂


If you enjoyed this post you’ll certainly enjoy these other ‘Just For Fun’ posts!

Juvenile? Absolutely, but hopefully one or more of these will give you a smile this morning 🙂
If you enjoyed this post you’ll certainly enjoy these other ‘Just For Fun’ posts!
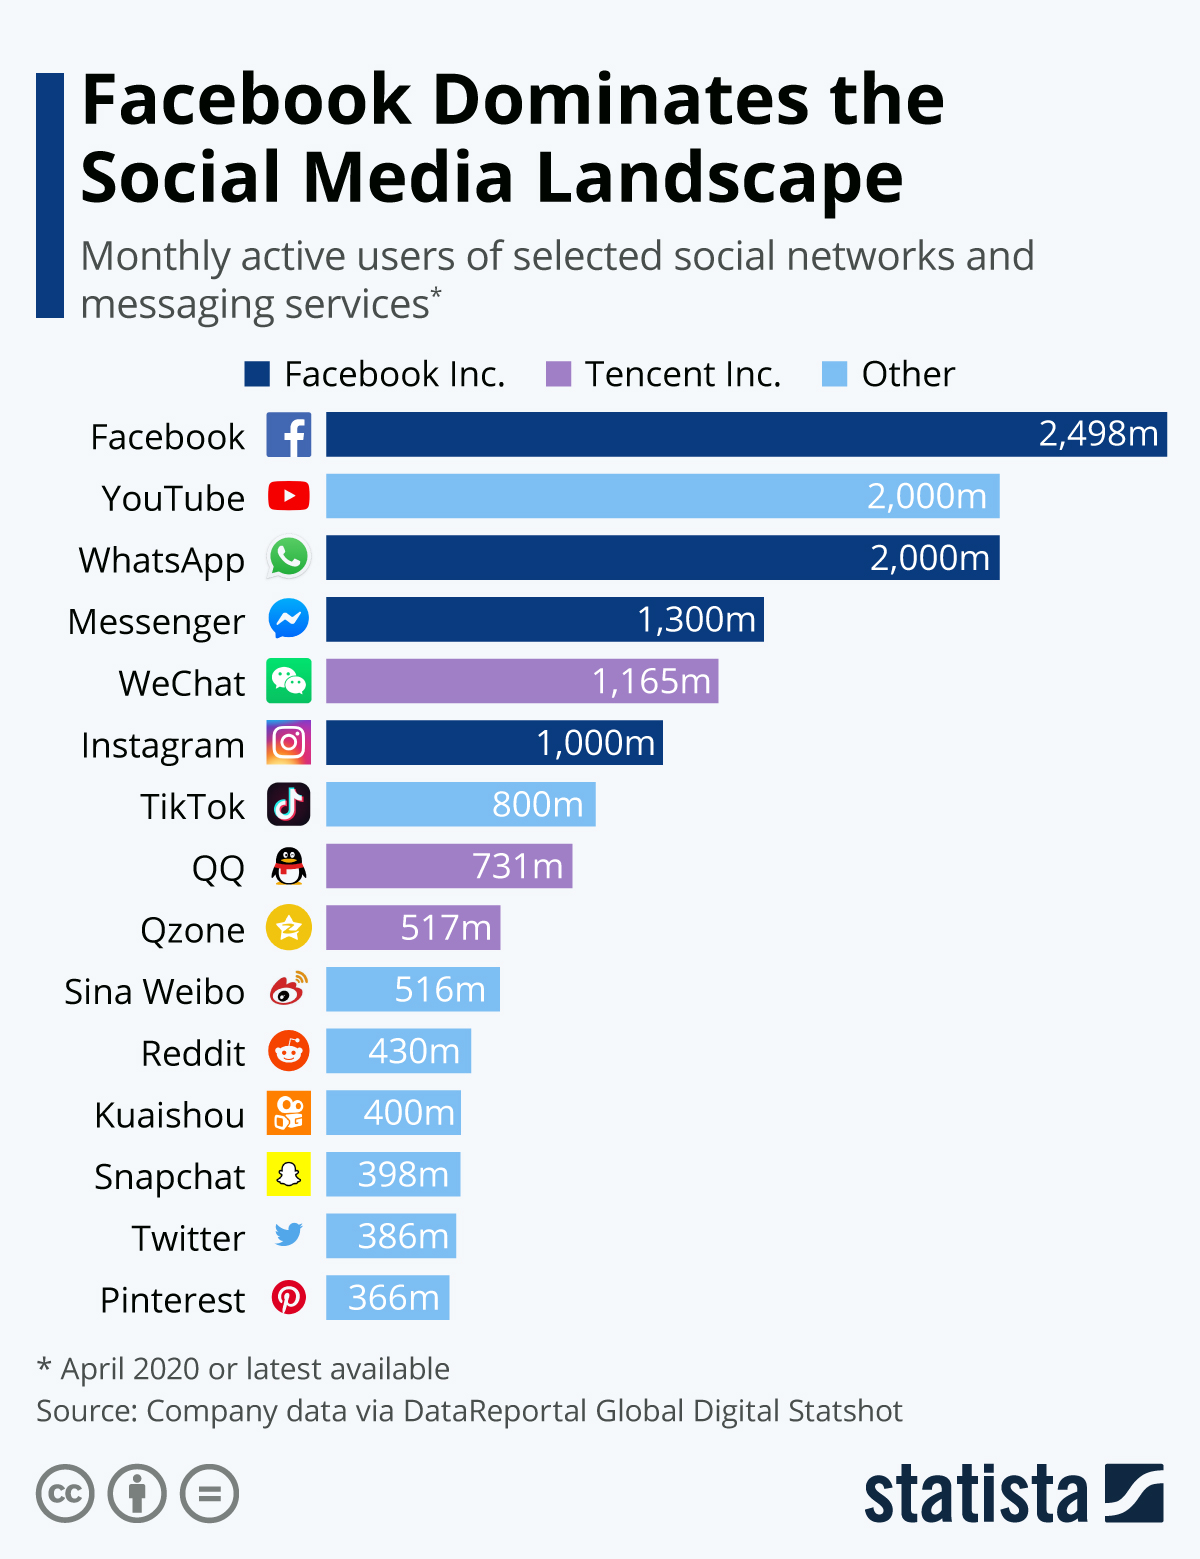
Source: Statista
hen people think of Facebook as a company, they mostly think of it synonymously with Facebook the social network. However, Facebook Inc. is much more than that, as today’s chart nicely illustrates. With WhatsApp, Instagram and of course the namesake Facebook and Messenger, the company owns four of the world’s largest social media / messaging services. Facebook alone is used by almost 2.5 billion people per month, while WhatsApp counts 2 billion monthly users and Messenger also has surpassed the billion user mark. According to company data aggregated by DataReportal, Tencent, the Chinese company behind WeChat, Qzone and messenger QQ also boasts almost 2.5 billion users in total, but it still doesn’t come close to matching Facebook’s global footprint.
What all of the services mentioned in the chart below have in common is their immense attractiveness to advertisers. Not only do they all boast hundreds of millions of users, but they also have the ability to target specific groups based on likes, dislikes and past behavior. That is why social media advertising has grown immensely over the past few years. Global social media ad revenue is expected to surpass $98 billion in 2020, according to the Statista Digital Market Outlook.
The latest data shows luxury home prices are starting to rebound
Seattle, WA – July 2, 2020 (PRNewswire) (NASDAQ: RDFN) — The median sale price for luxury homes nationwide dropped 2.3% year over year to $1,099,521 in the 12 weeks ending June 14, according to a new report from Redfin (www.redfin.com), the technology-powered real estate brokerage. This marks one of the biggest declines in luxury home prices since at least the beginning of 2015.
However, the latest data shows the luxury market may be starting to rebound, with the median sale price for homes in the top 5% rising 3.5% year over year for the seven day period ending June 14. The shorter timeframe has a smaller sample size and is less indicative of long-term trends, but provides a snapshot of recent numbers.
This is according to an analysis that divided all U.S. residential properties into five tiers based on Redfin Estimates of the homes’ market values as of mid-June. This report defines “luxury” as all the homes estimated to be in the top 5% based on market value. To represent non-luxury homes, Redfin uses the “middle” price tier, i.e. homes estimated to be in the 36th to 65th percentile for value. Redfin typically reports luxury data on a quarterly basis but released this analysis early because of the reversal in luxury home-sale price growth correlated with the onset of the pandemic.
“The pandemic is playing an outsized role in the luxury market, as very expensive homes are particularly sensitive to periods of economic uncertainty,” said Redfin economist Taylor Marr. “Many luxury buyers are nervous about pouring money into an investment that may be difficult to sell if the economy takes a nosedive. By comparison, people buying starter homes they plan to live in for 10 years are less concerned with volatile financial markets as long as they have money for a down payment and can afford monthly mortgage payments. And although access to credit is loosening up now, it tightened considerably for jumbo loans, which a lot of luxury buyers use, in April and May.”
Luxury price growth reversed course with the impact of the coronavirus pandemic: Price growth for homes in the top 5% had been on the upswing from October 2019 until March. The median luxury price started declining in the 12 weeks ending March 29 and saw its biggest dip (-2.5% YoY) in the 12 weeks ending June 7.
The top 5% of the market took a bigger hit from the pandemic than the rest of the housing market. The median sale price for non-luxury, mid-priced homes rose 4.1% year over year to $265,134 in the 12 weeks ending on June 14. Price growth for non-luxury homes started to reverse in mid-April after an upswing that started at the beginning of the year.
| Housing market summary, 12 weeks ending June 14 | ||
| Luxury (top 5% by market value) | Non-luxury (36th to 65th percentile by market value) | |
| Median sale price | $1,099,521 | $265,134 |
| Median sale price, YoY | -2.3% | 4.1% |
| Number of homes for sale, YoY | -6.7% | -17.2% |
| New listings of homes for sale, YoY | -19.3% | -25.8% |
| Sales of homes, YoY | -29.9% | -21.9% |
| Median days on market | 53.5 (-1.3 YoY) | 33.8 (-2 YoY) |
But the price increase seen in the week of June 7 to June 14 indicates that some luxury buyers are back in the market. Looking forward, prices for luxury homes may continue to experience a slight uptick as panic about the economy subsides.
“Luxury home prices have likely already bottomed out. Price growth may continue to be lower than last year through the summer and fall, but with smaller drops as the months go on,” Marr said. “The fact that prices increased in the beginning of June may represent pent-up demand because buyers held off during the height of pandemic panic. The top end of the real estate market will recover more slowly than the rest of it.”
The number of luxury homes for sale dropped 6.7% year over year during the 12 weeks ending June 14, while the supply of non-luxury homes for sale declined 17.2%. Supply growth started to drop pre-pandemic for both segments, with non-luxury homes seeing a decline first, in March 2019. Because luxury supply growth started to reverse a half-year later, the decline may soon catch up, especially because luxury homes tend to stay on the market longer before going under contract (a median of 53.5 days versus 33.8 days).
New listings of luxury homes fell 19.3% annually over the same time period, compared with a 25.8% drop for non-luxury homes. New listings in both segments of the market were rising pre-pandemic, though the peak year-over-year increase was higher for luxury than non-luxury homes (10.2% versus 1.6% in the 12 weeks ending March 15).
While the drop in new listings has been continuous since March for non-luxury homes, it has started to recover for the luxury market, which experienced its biggest new-listing decline (-23.7% YoY) in the 12 weeks ending May 31.
Sales of luxury homes, which had been rising since last September, also reversed course and started to decline in April. Luxury sales were down 29.9% year over year in the 12 weeks ending June 14, and non-luxury sales dropped 21.9%.
A handful of metro areas drove the overall decline in luxury sale prices. Prices of high-end homes in Dallas dropped 12% year over year in the 12 weeks ending June 14, more than any other metro, followed by Las Vegas (-6.7%) and Houston (-5%).
“Luxury home prices have been declining since the beginning of the year largely due to an oversupply of expensive newly built homes, and the downward trend has accelerated in the last three months,” said Dallas Redfin agent Pam Henderson. “Luxury buyers tend to take more time finding a home that suits all their wants and needs, touring many homes before they find the perfect fit. They typically aren’t buying a home because they need a place to live, so they don’t have much motivation to rush their search. Due to COVID-19, a lot of potential luxury buyers are putting their searches on hold because they don’t want to be out touring homes and increasing their risk of infection.”
In some areas, luxury home prices have continued to rise even with the pandemic. Prices rose most year over year in three East Coast metros: Providence (14.7%), Montgomery County, PA (11.2%) and Fort Lauderdale, FL (8.6%).
To read the full report, including methodology and a full breakout of metro-level data, please visit: https://www.redfin.com/blog/june-2020-luxury-housing-report.
About Redfin
Redfin (www.redfin.com) is a technology-powered residential real estate company, including brokerage, iBuying, mortgage, and title services. Founded by software engineers, we run the country’s #1 most-visited brokerage website and offer a host of online tools to consumers, including the Redfin Estimate. We represent people buying and selling homes in over 90 markets in the United States and Canada. In a commission-driven industry, our mission is to redefine real estate in the consumer’s favor. We do this by pairing our own agents with our own technology to create a service that is faster, better, and costs less. Since our launch in 2006, we have helped customers buy or sell more than 235,000 homes worth more than $115 billion.
For more information or to contact a local Redfin real estate agent, visit www.redfin.com. To learn about housing market trends and download data, visit the Redfin Data Center. To be added to Redfin’s press release distribution list, email press@redfin.com. To view Redfin’s press center, click here.
SOURCE Redfin