
AgencyLogic PowerSites include detailed statistics to answer, among other questions, how many people visit your single property Websites.
Please follow these steps to access the data and reports – if you have additional questions give us a call on:
or email:
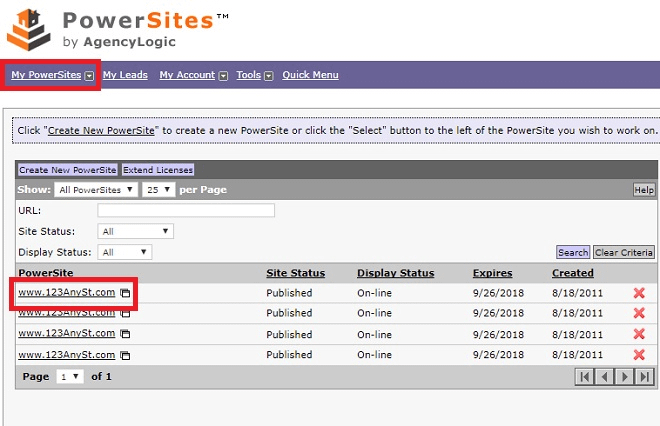
Step 1:
Log into your account and click the PowerSite you want to see reports on. You can also click “My PowerSites” to see a list of your single property Websites:
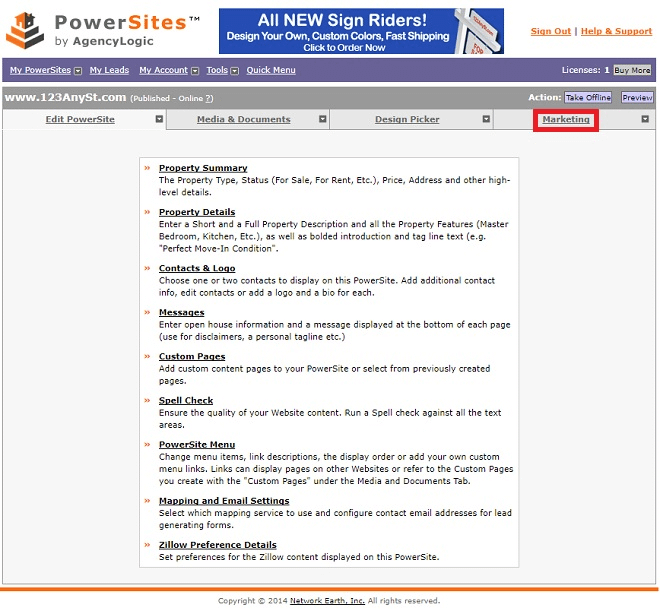
Step 2:
Click the “Marketing” tab:

Step 3:
Click the “PowerSite Statistics” link:

The default report is the “Overview” report – to select the “Site Activity” report simply click on the drop down box:

Note: You can change the date range to see activity over a longer or shorter period (make sure you click the “Refresh” button):

The “Site Activity” report details three metrics: Page Views, Visits and Hits:

As you look at the statistics you need to understand the following key terms:
Visits: A count of each time someone viewed your PowerSite. They can look at dozens of pages, download documents, floor plans etc. but this still counts as 1 visit. That same person could view your PowerSite later the same day and would count as another visit.
Page View: Is a count of each PowerSite page displayed. The whole page (images and photos) counts as 1 view.
Hit: Is the number of items displayed to your clients including a Web page, graphic or a photo. Each one counts as 1 hit.
In addition to the graphical representation of the data it is also shown in tabular form:
