– In the First Quarter of 2018, 84,000 Residential Properties Regained Equity
– About 2.5 Million Mortgaged Residential Properties Are Still in Negative Equity
– An Additional 500,000 Properties Would Return to an Equity Position if Home Prices Gained Another 5 Percent
– Over the Past Four Quarters, the Average Homeowner Gained $16,300 in Home Equity
Irvine, CA – June 7th (BUSINESS WIRE) CoreLogic® (NYSE: CLGX), a leading global property information, analytics and data-enabled solutions provider, today released the Home Equity Report for the first quarter of 2018, which shows that U.S. homeowners with mortgages (which account for roughly 63 percent of all properties) have seen their equity increase 13.3 percent year over year, representing a gain of $1.01 trillion since the first quarter of 2017.
Additionally, the average homeowner gained $16,300 in home equity between the first quarter of 2017 and the first quarter of 2018. While home equity grew nationwide, western states experienced the largest increase. Washington homeowners gained an average of approximately $44,000 in home equity, and California homeowners gained an average of approximately $51,000 in home equity (Figure 1).
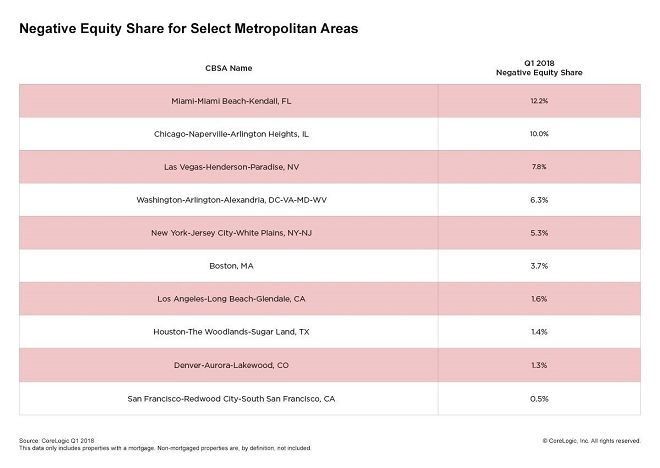
From the fourth quarter of 2017 to the first quarter of 2018, the total number of mortgaged homes in negative equity decreased 3 percent to just under 2.5 million homes or 4.7 percent of all mortgaged properties. Negative equity decreased 21 percent year over year from 3.1 million homes – or 6.1 percent of all mortgaged properties – in the first quarter of 2017.
“Home-price growth has accelerated in recent months, helping to build home-equity wealth and lift underwater homeowners back into positive equity the primary driver of home equity wealth creation,” said Dr. Frank Nothaft, chief economist for CoreLogic. “The CoreLogic Home Price Index grew 6.7 percent during the year ending March 2018, the largest 12-month increase in four years. Likewise, the average growth in home equity was more than $15,000 during 2017, the most in four years. Washington led all states with 12.8 percent appreciation, and its homeowners also had much larger home-equity gains than the national average.”


Negative equity, often referred to as being underwater or upside down, applies to borrowers who owe more on their mortgages than their homes are worth. Negative equity can occur because of a decline in a home’s value, an increase in mortgage debt or both. Negative equity peaked at 26 percent of mortgaged residential properties in the fourth quarter of 2009, based on the CoreLogic equity data analysis which began in the third quarter of 2009.
The national aggregate value of negative equity was approximately $284.8 billion at the end of the first quarter of 2018. This is up quarter over quarter by approximately $100 million, from $284.7 billion in the fourth quarter of 2017.
“Home equity balances continue to grow across the nation,” said Frank Martell, president and CEO of CoreLogic. “In the far Western states, equity gains are fueled by a long run in home price escalation. With strong economic growth and higher purchase demand, we expect these trends to continue for the foreseeable future.”
For ongoing housing trends and data, visit the CoreLogic Insights Blog: www.corelogic.com.
Methodology
The amount of equity for each property is determined by comparing the estimated current value of the property against the mortgage debt outstanding (MDO). If the MDO is greater than the estimated value, then the property is determined to be in a negative equity position. If the estimated value is greater than the MDO, then the property is determined to be in a positive equity position. The data is first generated at the property level and aggregated to higher levels of geography. CoreLogic data includes more than 50 million properties with a mortgage, which accounts for more than 95 percent of all mortgages in the U.S. CoreLogic uses public record data as the source of the MDO, which includes both first-mortgage liens and second liens, and is adjusted for amortization and home equity utilization in order to capture the true level of MDO for each property. The calculations are not based on sampling, but rather on the full data set to avoid potential adverse selection due to sampling. The current value of the property is estimated using a suite of proprietary CoreLogic valuation techniques, including valuation models and the CoreLogic Home Price Index (HPI). In August 2016, the CoreLogic HPI was enhanced to include nearly one million additional repeat sales records from proprietary data sources that provide greater coverage in home price changes nationwide. The increased coverage is particularly useful in 14 non-disclosure states. Additionally, a new modeling methodology has been added to the HPI to weight outlier pairs, ensuring increased consistency and reducing month-over-month revisions. The use of the enhanced CoreLogic HPI was implemented with the Q2 2016 Equity report. Only data for mortgaged residential properties that have a current estimated value are included. There are several states or jurisdictions where the public record, current value or mortgage data coverage is thin and have been excluded from the analysis. These instances account for fewer than 5 percent of the total U.S. population. The percentage of homeowners with a mortgage is from the 2016 American Community Survey. Fourth quarter of 2017 data was revised. Revisions with public records data are standard, and to ensure accuracy, CoreLogic incorporates the newly released public data to provide updated results.
Source: CoreLogic
The data provided is for use only by the primary recipient or the primary recipient’s publication or broadcast. This data may not be re-sold, republished or licensed to any other source, including publications and sources owned by the primary recipient’s parent company without prior written permission from CoreLogic. Any CoreLogic data used for publication or broadcast, in whole or in part, must be sourced as coming from CoreLogic, a data and analytics company. For use with broadcast or web content, the citation must directly accompany first reference of the data. If the data is illustrated with maps, charts, graphs or other visual elements, the CoreLogic logo must be included on screen or website. For questions, analysis or interpretation of the data, contact Alyson Austin at newsmedia@corelogic.com or Allyse Sanchez at corelogic@ink-co.com. Data provided may not be modified without the prior written permission of CoreLogic. Do not use the data in any unlawful manner. This data is compiled from public records, contributory databases and proprietary analytics, and its accuracy depends upon these sources.
About CoreLogic
CoreLogic (NYSE: CLGX) is a leading global property information, analytics and data-enabled solutions provider. The company’s combined data from public, contributory and proprietary sources includes over 4.5 billion records spanning more than 50 years, providing detailed coverage of property, mortgages and other encumbrances, consumer credit, tenancy, location, hazard risk and related performance information. The markets CoreLogic serves include real estate and mortgage finance, insurance, capital markets, and the public sector. CoreLogic delivers value to clients through unique data, analytics, workflow technology, advisory and managed services. Clients rely on CoreLogic to help identify and manage growth opportunities, improve performance and mitigate risk. Headquartered in Irvine, Calif., CoreLogic operates in North America, Western Europe and Asia Pacific. For more information, please visit www.corelogic.com.
CORELOGIC and the CoreLogic logo are trademarks of CoreLogic, Inc. and/or its subsidiaries. All other trademarks are the property of their respective owners.
Contacts
Media Contacts:
CoreLogic
Alyson Austin
Corporate Communications
(949) 214-1414
newsmedia@corelogic.com
or
INK Communications
Allyse Sanchez
(925) 548-2535
corelogic@ink-co.com
Like this:
Like Loading...