Washington, D.C. – March 21, 2018 (nar.realtor) Despite consistently low inventory levels and faster price growth, existing-home sales bounced back in February after two straight months of declines, according to the National Association of Realtors®. Sizeable sales increases in the South and West offset declines in the Northeast and Midwest.

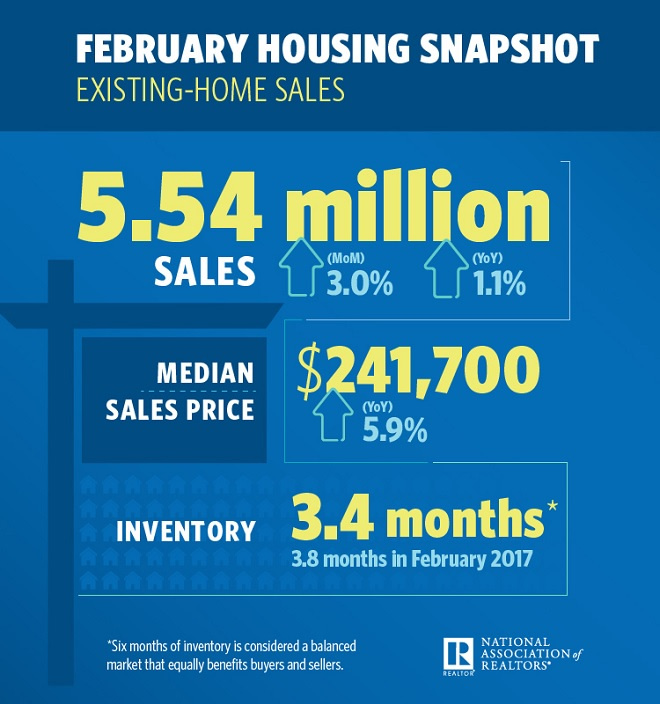
Total existing-home sales(1), https://www.nar.realtor/existing-home-sales, which are completed transactions that include single-family homes, townhomes, condominiums and co-ops, grew 3.0 percent to a seasonally adjusted annual rate of 5.54 million in February from 5.38 million in January. After last month’s increase, sales are now 1.1 percent above a year ago.
Lawrence Yun, NAR chief economist, says sales were uneven across the country in February but did increase nicely overall. “A big jump in existing sales in the South and West last month helped the housing market recover from a two-month sales slump,” he said. “The very healthy U.S. economy and labor market are creating a sizeable interest in buying a home in early 2018. However, even as seasonal inventory gains helped boost sales last month, home prices – especially in the West – shot up considerably. Affordability continues to be a pressing issue because new and existing housing supply is still severely subpar.”
Added Yun, “The unseasonably cold weather to start the year muted pending sales in the Northeast and Midwest in January and ultimately led to their sales retreat last month. Looking ahead, several markets in the Northeast will likely see even more temporary disruptions from the large winter storms that have occurred in March.”

The median existing-home price(2) for all housing types in February was $241,700, up 5.9 percent from February 2017 ($228,200). February’s price increase marks the 72nd straight month of year-over-year gains.
Total housing inventory(3) at the end of February rose 4.6 percent to 1.59 million existing homes available for sale, but is still 8.1 percent lower than a year ago (1.73 million) and has fallen year-over-year for 33 consecutive months. Unsold inventory is at a 3.4-month supply at the current sales pace (3.8 months a year ago).
According to Freddie Mac, the average commitment rate (link is external) for a 30-year, conventional, fixed-rate mortgage moved higher for the fifth straight month to 4.33 percent in February (highest since 4.34 percent in April 2014) from 4.03 percent in January. The average commitment rate for all of 2017 was 3.99 percent.
Properties typically stayed on the market for 37 days in February, which is down from 41 days in January and 45 days a year ago. Forty-six percent of homes sold in February were on the market for less than a month.
“Mortgage rates are at their highest level in nearly four years, at a time when home prices are still climbing at double the pace of wage growth,” said Yun. “Homes for sale are going under contract a week faster than a year ago, which is quite remarkable given weakening affordability conditions and extremely tight supply. To fully satisfy demand, most markets right now need a substantial increase in new listings.”
Realtor.com®’s Market Hotness Index, measuring time-on-the-market data and listings views per property, revealed that the hottest metro areas in February were San Francisco-Oakland-Hayward, Calif.; Midland, Texas; Vallejo-Fairfield, Calif.; San Jose-Sunnyvale-Santa Clara, Calif.; and Sacramento-Roseville-Arden-Arcade, Calif.
First-time buyers were 29 percent of sales in February, which is unchanged from last month and down from 31 percent a year ago. NAR’s 2017 Profile of Home Buyers and Sellers – released in late 2017(5) – revealed that the annual share of first-time buyers was 34 percent.
NAR President Elizabeth Mendenhall, a sixth-generation Realtor® from Columbia, Missouri and CEO of RE/MAX Boone Realty, says first-time buyers are seeing stiff competition for the available listings in their price range. “Realtors® in several markets note that entry-level homes for first-timers are hard to come by, which is contributing to their underperforming share of overall sales to start the year.” she said. “Prospective buyers should start conversations with a Realtor® now on what they want in a new home. Even with the expected uptick in new listings in coming months, buyers in most markets will likely have to act fast on any available listing that checks all their boxes.”
All-cash sales were 24 percent of transactions in February, which is up from 22 percent in January and the highest since last February (27 percent). Individual investors, who account for many cash sales, purchased 15 percent of homes in February, which is down from 17 percent in January and unchanged from a year ago.
Distressed sales(5) – foreclosures and short sales – were 4 percent of sales in February, down from 5 percent in January and 7 percent a year ago. Three percent of February sales were foreclosures and 1 percent were short sales.
Single-family and Condo/Co-op Sales
Single-family home sales rose 4.2 percent to a seasonally adjusted annual rate of 4.96 million in February from 4.76 million in January, and are now 1.8 percent above the 4.87 million pace a year ago. The median existing single-family home price was $243,400 in February, up 5.9 percent from February 2017.
Existing condominium and co-op sales declined 6.5 percent to a seasonally adjusted annual rate of 580,000 units in February, and are now 4.9 percent below a year ago. The median existing condo price was $227,300 in February, which is 5.7 percent above a year ago.
Regional Breakdown
February existing-home sales in the Northeast fell 12.3 percent to an annual rate of 640,000, and are now 7.2 percent below a year ago. The median price in the Northeast was $258,900, which is 3.6 percent above February 2017.
In the Midwest, existing-home sales dipped 2.4 percent to an annual rate of 1.22 million in February (unchanged from a year ago). The median price in the Midwest was $179,400, up 4.5 percent from a year ago.
Existing-home sales in the South jumped 6.6 percent to an annual rate of 2.41 million in February, and are now 3.4 percent above a year ago. The median price in the South was $215,700, up 5.4 percent from a year ago.
Existing-home sales in the West surged 11.4 percent to an annual rate of 1.27 million in February, and are now 2.4 percent above a year ago. The median price in the West was $370,600, up 9.6 percent from February 2017.
The National Association of Realtors® is America’s largest trade association, representing 1.3 million members involved in all aspects of the residential and commercial real estate industries.
# # #
NOTE: For local information, please contact the local association of Realtors® for data from local multiple listing services. Local MLS data is the most accurate source of sales and price information in specific areas, although there may be differences in reporting methodology.
1. Existing-home sales, which include single-family, townhomes, condominiums and co-ops, are based on transaction closings from Multiple Listing Services. Changes in sales trends outside of MLSs are not captured in the monthly series. NAR rebenchmarks home sales periodically using other sources to assess overall home sales trends, including sales not reported by MLSs.
Existing-home sales, based on closings, differ from the U.S. Census Bureau’s series on new single-family home sales, which are based on contracts or the acceptance of a deposit. Because of these differences, it is not uncommon for each series to move in different directions in the same month. In addition, existing-home sales, which account for more than 90 percent of total home sales, are based on a much larger data sample – about 40 percent of multiple listing service data each month – and typically are not subject to large prior-month revisions.
The annual rate for a particular month represents what the total number of actual sales for a year would be if the relative pace for that month were maintained for 12 consecutive months. Seasonally adjusted annual rates are used in reporting monthly data to factor out seasonal variations in resale activity. For example, home sales volume is normally higher in the summer than in the winter, primarily because of differences in the weather and family buying patterns. However, seasonal factors cannot compensate for abnormal weather patterns.
Single-family data collection began monthly in 1968, while condo data collection began quarterly in 1981; the series were combined in 1999 when monthly collection of condo data began. Prior to this period, single-family homes accounted for more than nine out of 10 purchases. Historic comparisons for total home sales prior to 1999 are based on monthly single-family sales, combined with the corresponding quarterly sales rate for condos.
2. The median price is where half sold for more and half sold for less; medians are more typical of market conditions than average prices, which are skewed higher by a relatively small share of upper-end transactions. The only valid comparisons for median prices are with the same period a year earlier due to seasonality in buying patterns. Month-to-month comparisons do not compensate for seasonal changes, especially for the timing of family buying patterns. Changes in the composition of sales can distort median price data. Year-ago median and mean prices sometimes are revised in an automated process if additional data is received.
The national median condo/co-op price often is higher than the median single-family home price because condos are concentrated in higher-cost housing markets. However, in a given area, single-family homes typically sell for more than condos as seen in NAR’s quarterly metro area price reports.
3. Total inventory and month’s supply data are available back through 1999, while single-family inventory and month’s supply are available back to 1982 (prior to 1999, single-family sales accounted for more than 90 percent of transactions and condos were measured only on a quarterly basis).
4. Survey results represent owner-occupants and differ from separately reported monthly findings from NAR’s Realtors® Confidence Index, which include all types of buyers. Investors are under-represented in the annual study because survey questionnaires are mailed to the addresses of the property purchased and generally are not returned by absentee owners. Results include both new and existing homes.
5. Distressed sales (foreclosures and short sales), days on market, first-time buyers, all-cash transactions and investors are from a monthly survey for the NAR’s Realtors® Confidence Index, posted at nar.realtor.
Media Contact:
Adam DeSanctis
(202) 383-1178
Email
Like this:
Like Loading...