RE/MAX Holdings To Release Fourth Quarter And Full Year 2018 Results On February 21, 2019

Denver, CO – Jan. 7, 2019 (PRNewswire) RE/MAX Holdings, Inc. (the “Company”) (NYSE: RMAX), parent company of RE/MAX, one of the world’s leading franchisors of real estate brokerage services, and of Motto Mortgage, an innovative mortgage brokerage franchisor, will release financial results for the fourth quarter and full year ended December 31, 2018, after market close on Thursday, February 21, 2019, and will host a conference call for interested parties on Friday, February 22, 2019, at 8:30 a.m. Eastern Time.

Remax Logo

Interested parties are able to access the conference call using the following dial-in numbers:

U.S.: (833) 287-0798
Canada & International: (647) 689-4457

Interested parties are also able to access a live webcast through the Company’s Investor Relations website at investors.remax.com. Please dial-in or join the webcast 10 minutes before the start of the conference call. An archive of the webcast will be available on the Investor Relations website for a limited time as well.

About RE/MAX Holdings, Inc.
RE/MAX Holdings, Inc. (NYSE: RMAX) is one of the world’s leading franchisors in the real estate industry, franchising real estate brokerages globally under the RE/MAX® brand, and mortgage brokerages within the U.S. under the Motto® Mortgage brand. RE/MAX was founded in 1973 by David and Gail Liniger, with an innovative, entrepreneurial culture affording its agents and franchisees the flexibility to operate their businesses with great independence. Now with more than 120,000 agents across over 100 countries and territories, nobody in the world sells more real estate than RE/MAX, as measured by total residential transaction sides. Dedicated to innovation and change in the real estate industry, RE/MAX launched Motto Franchising, LLC, a ground-breaking mortgage brokerage franchisor, in 2016.

LendingTree Releases Monthly Mortgage Offer Report for December

LendingTree’s Chief Economist analyzes December’s mortgage offers

Charlotte, NC – Jan. 9, 2019 (PRNewswire) LendingTree®, the nation’s leading online loan marketplace, today released its monthly Mortgage Offers Report, which analyzes data from actual loan terms offered to borrowers on LendingTree.com by lenders on LendingTree’s network. The purpose of the report is to empower consumers by providing additional information on how their credit profile affects their loan prospects.

Lendingtree Logo

  • December’s best mortgage offers for borrowers with the best profiles had an average APR of 4.35% for conforming 30-year, fixed-rate purchase loans, down from 4.66% in November. The APR on refinance loan offers also decreased from 4.63% in November to 4.34%. We consider people with the best credit profiles to be those in the 95th percentile of borrowers who received the best mortgage offers through the LendingTree marketplace, which allows users to compare offers from multiple mortgage lenders.
  • Mortgage rates vary depending upon parameters including credit score, loan-to-value ratio, income and property type.
    For the average borrower, the purchase APR for conforming 30-year, fixed-rate purchase loans offered on LendingTree’s platform was 5.17%, down 18 basis points from November. The loan note rate of 5.05% was down 19 basis points from November. We prefer to emphasize the APR as lenders often make changes to other fees in response to changing interest rates.
  • Consumers with the highest credit scores (760+, representing the 65th percentile of borrowers) received an average APR of 4.98%, versus 5.33% for consumers with scores of 680 to 719. The APR spread of 65 basis points between these score ranges is higher than it was in November. For the average purchase loan amount of $224,609, the spread represents over $17,000 in additional costs for borrowers with lower credit scores over 30 years. The additional costs result from higher interest rates, larger fees or a combination of the two.
  • For the average borrower, the APR for conforming 30-year, fixed-rate refinance loans decreased 24 basis points from November to 5.09%. At 4.93% and 5.21%, respectively, the spread between credit score brackets (760+ and 680-719) was 28 basis points. That amounts to nearly $13,000 in extra costs over the life of the loan for borrowers with lower credit scores, given an average refinance loan of $239,329.
  • Average proposed purchase down payments fell to $54,217, a decline of nearly $6,000.

Chart

Purchase APR by Credit Score Range

Chart

* Lifetime interest paid is calculated based on the overall average loan amount to enable comparison.

Chart

*Lifetime interest paid is calculated based on the overall average loan amount to enable comparison.

To view the Mortgage Offers Report, visit: www.lendingtree.com.

LendingTree also released its weekly Mortgage Comparison Shopping Report, containing the Mortgage Rate Distribution and Mortgage Rate Competition Index. This week’s report found that 80.9 percent of purchase borrowers received mortgage rates under 5 percent last week. Homebuyers could have seen median lifetime savings of $30,377 in interest on a $300,000 loan by comparison shopping for the best mortgage rates.

About the Report

The LendingTree Mortgage Offers Report contains data from actual loan terms offered to borrowers on LendingTree.com by lenders. We believe it is an important addition to standard industry surveys and reports on mortgage rates. Most quoted industry rates are for a hypothetical borrower with prime credit who makes a 20% down payment. Most borrowers do not fit this profile. Our report includes the average quoted APR by credit score, together with the average down payment and other metrics described below. We stratify by credit score, so borrowers have added information on how their credit profile affects their loan prospects. The report covers conforming 30-yr fixed loans for both purchase and refinance.

  • APR: Actual APR offers to borrowers on our platform
  • Down Payment: Though analogous to the LTV, we find that borrowers identify more closely with the down payment. Academic studies have also found that the down payment is the primary concern for homebuyers and one of the main impediments to entering the homebuying market.
  • Loan Amount: The average loan amount borrowers are offered
  • LTV: Actual LTV offered to borrowers on our platform
  • Lifetime Interest Paid: This is the total cost a borrower incurs for the loan, inclusive of fees.

About LendingTree

LendingTree (NASDAQ: TREE) is the nation’s leading online marketplace that connects consumers with the choices they need to be confident in their financial decisions. LendingTree empowers consumers to shop for financial services the same way they would shop for airline tickets or hotel stays, comparing multiple offers from a nationwide network of over 500 partners in one simple search, and can choose the option that best fits their financial needs. Services include mortgage loans, mortgage refinances, auto loans, personal loans, business loans, student refinances, credit cards and more. Through the My LendingTree platform, consumers receive free credit scores, credit monitoring and recommendations to improve credit health. My LendingTree proactively compares consumers’ credit accounts against offers on our network, and notifies consumers when there is an opportunity to save money. In short, LendingTree’s purpose is to help simplify financial decisions for life’s meaningful moments through choice, education and support. LendingTree, LLC is a subsidiary of LendingTree, Inc. For more information, go to www.lendingtree.com, dial 800-555-TREE, like our Facebook page and/or follow us on Twitter @LendingTree.

Media Contact:

Megan Greuling
(704) 943-8208
Megan.greuling@lendingtree.com

U.S. Renters Spent $504 Billion on Housing in 2018

– Renters spent more on housing than ever before in 2018, even with fewer renter households

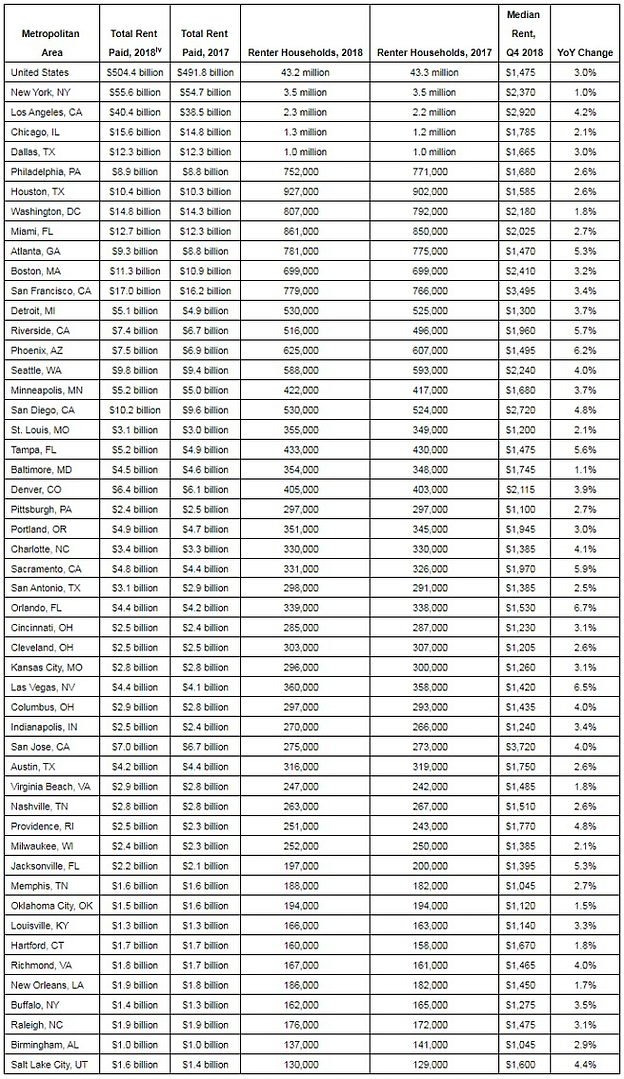
– Renters paid $12.6 billion more in rent this year than they did in 2017 – which is about a 2.6 percent increase.

– There are about 43.2 million households renting in the United States, a slight decline from 2017.

– More than 10 percent ($55.6 billion) of all rent collected in the United States came from renters living in the New York City metro area.

– Rents are currently rising the fastest in Orlando and Las Vegas, and renters in each of those cities spent about $4.4 billion on rent this year.

SAN FRANCISCO, Dec. 21, 2018 (PRNewswire) U.S. households spent a record amount on rent in 2018 despite a decrease in the number of households who rent their home, according to a new HotPads® analysis. Overall, the U.S. spent $504.4 billion on rent in 2018 – more than the entire GDP of Belgium ($494.7 billion)(i) and three times the current net worth of Amazon CEO Jeff Bezos ($124 billion)(ii).

Renters spent $12.6 billion more paying their rent in 2018 than they did in 2017. The current median rent is $1,475, up 3 percent from a year ago. Throughout 2018, rents rose about 3 percent year over year – continuing a gradual slowdown in rent appreciation that began in mid-2016.

However, the number of renter households in the U.S. decreased slightly in 2018. There were about 43.2 million renter households across the country this year – nearly 100,000 fewer than in 2017.

A gradual slowdown in rent appreciation has allowed renters looking to purchase homes greater ability to save for a down payment in recent years, and millennials – the generation comprising half of today’s renters — are also buying homes more than any other generation(iii). With more eligible buyers on the market, the number of renter households has decreased slightly over the past year.

“After several years of a booming economy, more millennials became financially able to become home owners in 2018,” said Joshua Clark, economist at HotPads. “However, rent affordability continues to be a challenge, as those who still rent are paying even higher prices now than they were a year ago. If interest rates continue rising in 2019, more would-be homebuyers may decide to continue renting, which could put additional pressure on rent prices. Fortunately for renters, the housing market is also cooling nationwide, signaling that the entire market may be leveling off and making it easier for renters to keep up with housing expenses.”

Of the 50 largest metro areas in the U.S., renters in the New York City metro area spent the most on rent this year – a total of $55.6 billion. However, rent growth in the New York metro also slowed in 2018. Rents in the New York City metro area are rising just 1 percent annually now, compared to 1.8 percent annually at this time last year.

While rent appreciation has been steady or slowed in many metro areas, some markets in the Southeast and Southwest are still seeing significant price gains. Rents are appreciating the fastest in Orlando, Las Vegas and Phoenix, at a rate more than twice as fast as the national median. Renters in Orlando and Las Vegas spent about $4.4 billion on rent in 2018, while renters in Phoenix spent about $7.5 billion.

HotPads is a Zillow® Group-owned apartment and home search platform for renters in urban areas across the United States. For more information on the U.S. rental market, visit HotPads.com.

Chart

HotPads is an efficient rental search platform for urban areas across the United States, with features designed for competitive markets such as map-based search, real-time notifications and detailed information on landlords and property managers that help renters spend less time searching and more time feeling excited about their next home.

Launched in 2005, HotPads is based in San Francisco and is owned and operated by Zillow Group, Inc. (NASDAQ: Z and ZG).

HotPads is a registered trademark of Zillow, Inc.

(i) U.S. Bureau of Economic Analysis, 2017

(ii) As of December 20, 2018. https://www.bloomberg.com/billionaires/profiles/jeffrey-p-bezos/

(iii) Millennials are the largest single group of home renters (50 percent) and home buyers (42 percent), according to the 2018 Zillow Group Report on Consumer Housing Trends.

(iv) Projected through the end of 2018