Source: Statista
Which cities in the United States are the most diverse? It depends on the definition. A Statista analysis of American Community Survey data shows that the metro areas appearing most diverse at first glance might not be the most mixed places after all.
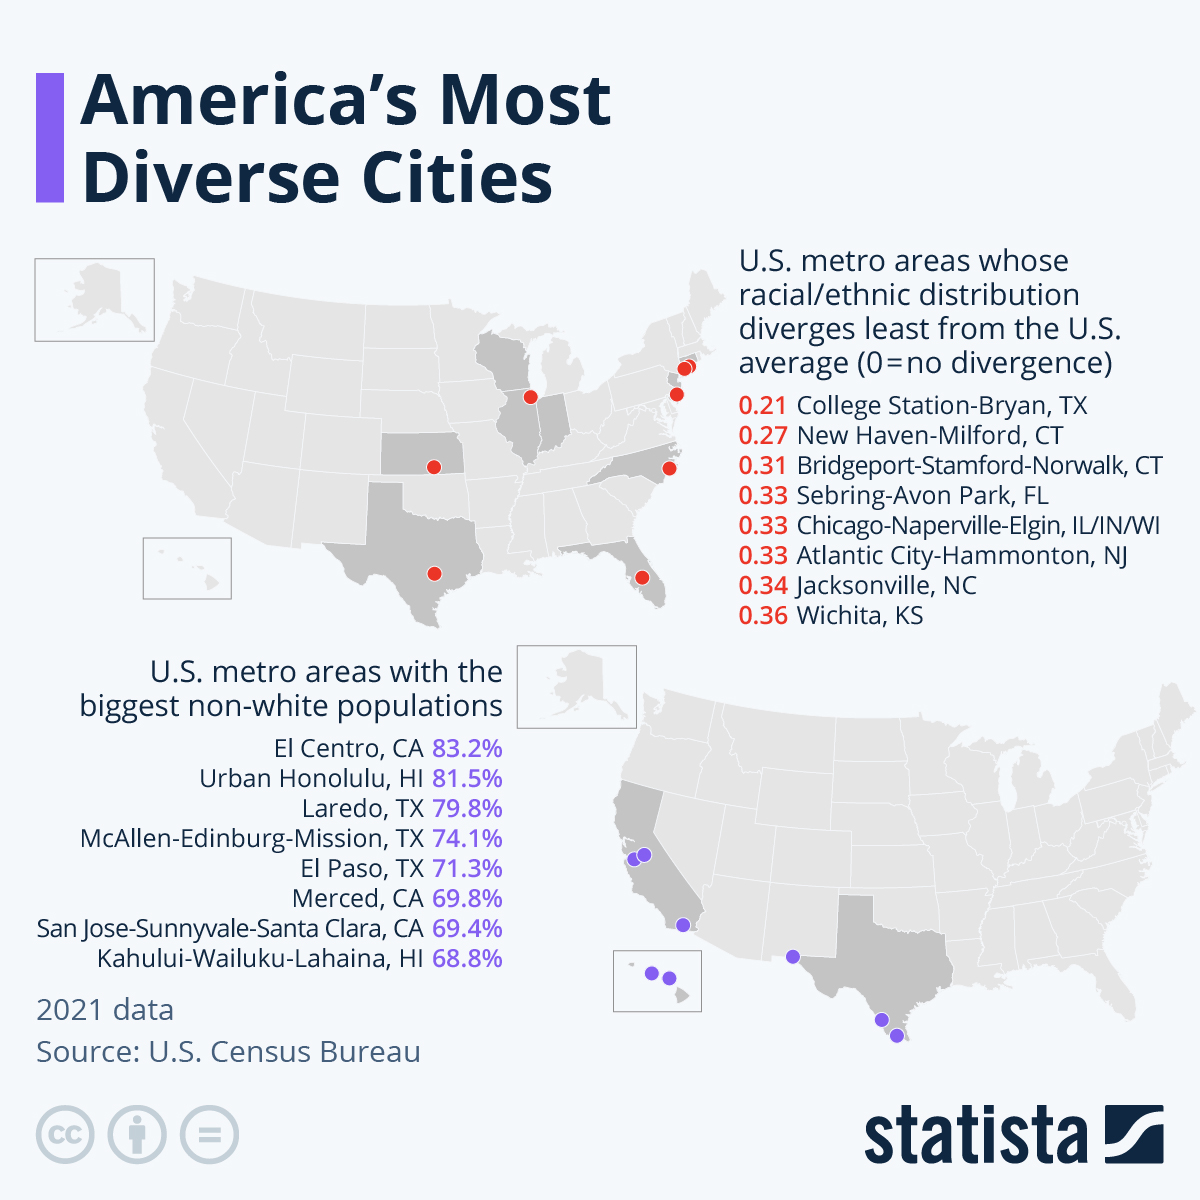
Out of almost 400 metro areas listed with the Census Bureau in the 50 U.S. states, the ones where the biggest shares of the population identify as a race other than white can be found in California, Texas and Hawaii. El Centro in California – registering the highest share of non-white population at 82.3 percent – as well as Laredo, McAllen-Edinburg-Mission and El Paso in Texas all hug the border with Mexico, which has led to especially high Latino populations in these places. According to the Census, Latinos in the U.S. most often identify their race as “other” or “more than one race”, while around 20 percent define their race as white. This leads to the share of the Latino populations of the four aforementioned metros ranging between 83 percent in El Paso and a whopping 96 percent in Laredo. Urban Honolulu and the Kahului-Wailuku-Lahaina metro in Hawaii as well as San Jose-Sunnyvale-Santa Clara, Calif., meanwhile owe their high non-white populations to the concentration of another race: Asians. Their share ranges from 30 percent to 42 percent in these metros.
However, does a high shares of a single race or ethnicity other than white people constitutes true diversity? In another approach, an index score calculated by Statista measures the divergence of the racial and ethnic makeups of metro areas from the U.S. average. Here, Texas’ College Station-Bryan, a metro of around 270,000 people home to the flagship campus of Texas A&M University, is the city most closely matching the U.S. average. The metro’s white population stands at around 65 percent, a little higher than the 61.2 percent U.S. average. Apart from that, divergence remains under one percentage point for most races, with the notable exception of Latinos, whose share is 8 percentage points higher. But with white populations reaching as high as 72 percent (in the case of Wichita) within the top 8 of this index, it also is an imperfect way to measure diversity.
Finally, a second index that combines both aspects – divergence from the U.S. average racial and ethnic distribution and divergence from the United States’ most non-white metro – hits on more of the country’s large cities. The list is led by New York City, followed by Washington D.C., Chicago, Atlantic City, NJ, and San Francisco. In the case of New York, a white population of around 46 percent, combined with somewhat elevated levels of inhabitants from all other races and ethnicities facilitates the top score. In ranks 6 to 8, Bridgeport-Stamford-Norwalk in Connecticut reappears, followed by Goldsboro, North Carolina, and Trenton-Princeton, New Jersey.