Inflation Cools to Lowest Level Since March 2021

Source: Statista

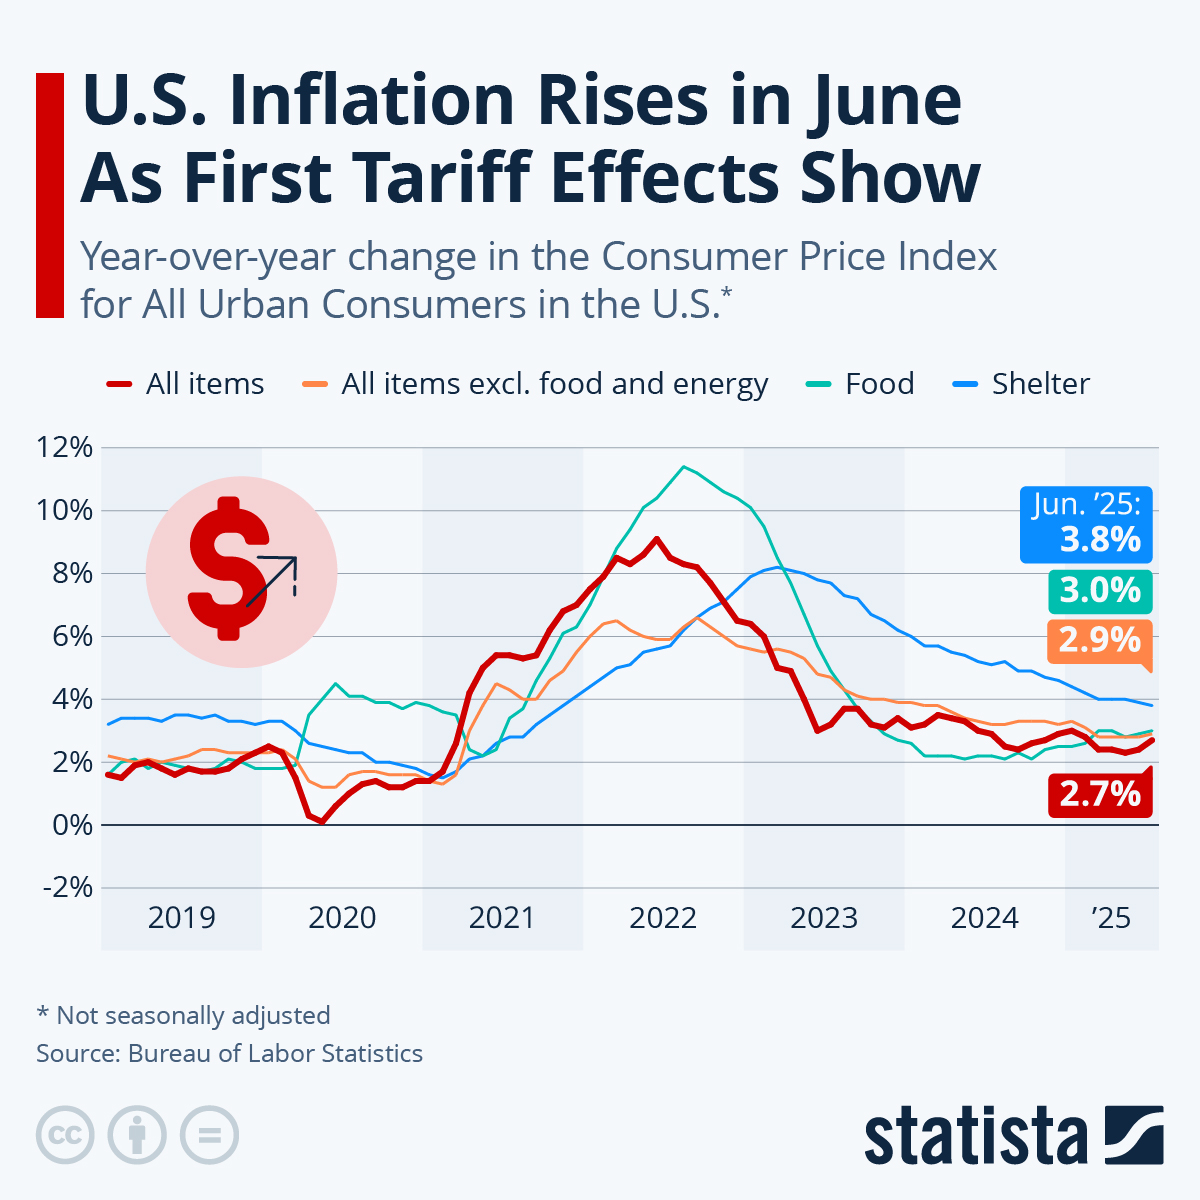
Inflation in the U.S. continued its downward trend in June, falling to the lowest level in more than two years, as the Consumer Price Index for All Urban Consumers (CPI-U) increased by 3.0 percent compared to the same month a year ago. That’s the smallest increase since March 2021, when inflation was just beginning to heat up.

Back then in the spring of 2021, the high inflation readings could largely be explained by the so-called base effect, as prices had fallen sharply at the onset of the pandemic a year earlier, when demand for many goods and services had suddenly dried up. Due to that initial dip in consumer prices, year-over-year comparisons were exaggerated for a while, but towards the end of 2021 inflation became a real concern, which turned into a global crisis when Russia attacked Ukraine, resulting in surging food and energy prices.

The fact that the war in Ukraine has been dragging on for more than a year now is also the reason why the latest, pleasantly low inflation readings should be taken with a pinch of salt. Following Russia’s invasion of Ukraine in late February of 2022, consumer prices, especially for food and energy, climbed sharply, meaning that current price levels are compared to a period of already elevated prices. In fact, energy prices dropped 16.7 percent over the last 12 months, meaning that the overall reading would have been higher without their cooling effect.

The core CPI excluding food and energy increased 4.8 percent – the lowest rate since October 2021 – while the index excluding just energy increased by 5 percent year-over-year. By far the largest driver of inflation in June was the cost of shelter. With rents and owners’ equivalent rents of residences increasing 8.3 and 7.8 percent in June, respectively, the index for shelter accounted for more than 70 percent of the all-items increase.

Infographic: Inflation Cools to Lowest Level Since March 2021 | Statista

America’s Most Diverse Cities

Source: Statista

Which cities in the United States are the most diverse? It depends on the definition. A Statista analysis of American Community Survey data shows that the metro areas appearing most diverse at first glance might not be the most mixed places after all.

Out of almost 400 metro areas listed with the Census Bureau in the 50 U.S. states, the ones where the biggest shares of the population identify as a race other than white can be found in California, Texas and Hawaii. El Centro in California – registering the highest share of non-white population at 82.3 percent – as well as Laredo, McAllen-Edinburg-Mission and El Paso in Texas all hug the border with Mexico, which has led to especially high Latino populations in these places. According to the Census, Latinos in the U.S. most often identify their race as “other” or “more than one race”, while around 20 percent define their race as white. This leads to the share of the Latino populations of the four aforementioned metros ranging between 83 percent in El Paso and a whopping 96 percent in Laredo. Urban Honolulu and the Kahului-Wailuku-Lahaina metro in Hawaii as well as San Jose-Sunnyvale-Santa Clara, Calif., meanwhile owe their high non-white populations to the concentration of another race: Asians. Their share ranges from 30 percent to 42 percent in these metros.

However, does a high shares of a single race or ethnicity other than white people constitutes true diversity? In another approach, an index score calculated by Statista measures the divergence of the racial and ethnic makeups of metro areas from the U.S. average. Here, Texas’ College Station-Bryan, a metro of around 270,000 people home to the flagship campus of Texas A&M University, is the city most closely matching the U.S. average. The metro’s white population stands at around 65 percent, a little higher than the 61.2 percent U.S. average. Apart from that, divergence remains under one percentage point for most races, with the notable exception of Latinos, whose share is 8 percentage points higher. But with white populations reaching as high as 72 percent (in the case of Wichita) within the top 8 of this index, it also is an imperfect way to measure diversity.

Finally, a second index that combines both aspects – divergence from the U.S. average racial and ethnic distribution and divergence from the United States’ most non-white metro – hits on more of the country’s large cities. The list is led by New York City, followed by Washington D.C., Chicago, Atlantic City, NJ, and San Francisco. In the case of New York, a white population of around 46 percent, combined with somewhat elevated levels of inhabitants from all other races and ethnicities facilitates the top score. In ranks 6 to 8, Bridgeport-Stamford-Norwalk in Connecticut reappears, followed by Goldsboro, North Carolina, and Trenton-Princeton, New Jersey.

Infographic: America's Most Diverse Cities | Statista

Who Owns the Most Land in the US? (Infographic)

We keep hearing about billionaires buying land all around the world, especially in the US. Have you ever wondered who owns the most land? This infographic from the Madison Trust gives you an idea:

Who Owns the Most Land in the United States?