The Gap Between Buying and Renting Narrows Nationwide

— Purchasing a home still more expensive in majority of larger metros

— Monthly cost to purchase the U.S. median home was $1,600, compared to the median monthly rent of $1,319 In the fourth quarter of 2019

— Monthly cost to buy fell 1 percent year-over-year, while rent increased by 4 percent

— On average, the cost of buying the median home fell, now accounting for 30 percent of the national median income, while renting remained level at 25 percent

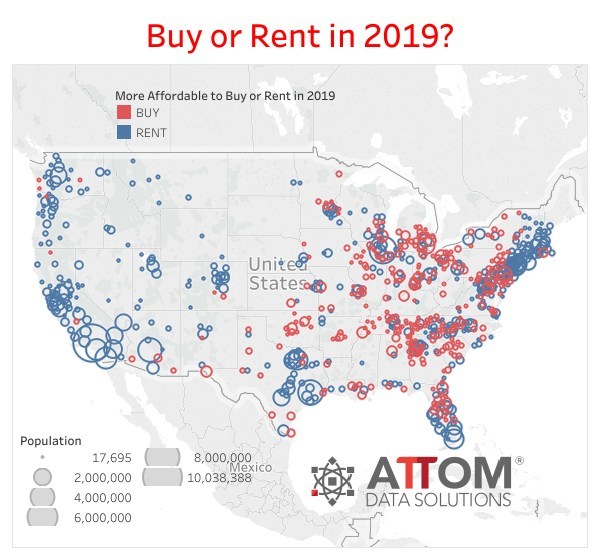
Santa Clara, CA – Jan. 29, 2020 (PRNewswire) After years of skyrocketing home prices, the combination of rising rents, lower mortgage rates and moderating home prices are making purchasing a home more attractive in many of the nation’s largest metros, according to realtor.com®‘s quarterly Rent vs. Buy report released today.

The report, which analyzed the cost of buying versus renting in 593 counties across the U.S., in the fourth quarter of 2019, found that it was cheaper to buy than rent in 16 percent of the counties with populations of 100,000 or more, up from 12 percent a year earlier. Despite homeownership becoming more affordable, it is still cheaper to rent than buy in 84 percent of the nation’s largest counties, including New York City, San Francisco and Los Angeles.

“The move toward a more balanced equation is good news for home sellers during this spring home buying season as more people, especially the large cohort of millennials who turn 30 this year, begin to weigh the cost of buying versus renting,” said realtor.com® Senior Economist George Ratiu. “Due to a combination of factors, we saw the monthly cost to buy a home fall 1 percent year-over-year, while rents increased 4 percent during the same time frame.”

The monthly cost to buy the national median-priced home was approximately $1,600, or 30 percent of the national median household income, in the fourth quarter of 2019, in line with the budgeting rule of spending no more than 30 percent of gross income on housing costs. The cost to rent increased to $1,319, representing 25 percent of the median household income in the fourth quarter of 2019.

Over the past year, 26 of the 593 counties analyzed shifted from being more affordable to rent to being more affordable to buy, including in the Cleveland, Bronx County, N.Y., Indianapolis and Columbia, S.C, areas.

Although it is still cheaper to rent than buy, some of the nation’s most expensive housing markets, including Kings and New York counties in N.Y., along with Santa Cruz County, Calif., saw the gap between renting and buying decrease the most: by 24 percent, 20 percent, and 18 percent, respectively.

Counties Where Buying is More Attractive

The median listing prices in the counties where buying a home was more affordable were on average 53 percent lower than the national median listing price of $300,000. Median rents, while still less expensive, were only 11 percent cheaper on average.

RankCountyPercent of
Income to
Buy
Percent of
Income to
Rent
1Clayton, Ga.18%32%
2Baltimore City, Md.23%35%
3Cumberland, N.J.21%32%
4Richmond, Ga.17%28%
5Vigo, Ind.12%22%
6Wayne, Mich.18%27%
7Muscogee, Ga.20%28%
8Cambria, Pa.11%19%
9Hampton city, Va.22%30%
10Jefferson, N.Y.24%31%

Counties Where Renting is More Attractive 

The median listing prices in the counties where renting is more affordable, were on average 260 percent higher than the national median of $300,000. Median rents, while also more expensive, were only 79 percent more expensive on average.

RankCountyPercent of
Income to
Buy
Percent of
Income to
Rent
1New York, N.Y.117%30%
2Santa Barbara, Calif.116%38%
3Monterey, Calif.90%31%
4San Mateo, Calif.77%31%
5San Francisco, Calif.79%33%
6Marin, Calif.77%33%
7Napa, Calif.69%28%
8Los Angeles, Calif.77%36%
9Kings, N.Y.81%42%
10Maui, Hawaii64%30%

Notes on Methodology

*Purchase and rent costs reflect current costs and do not take into account holding period, price and rent appreciation, and inflation. Purchase costs do include taxes and insurance and are calculated based on realtor.com county-level residential listing price data and mortgage rate data for December 2019. Rental prices are from the U.S. Department of Housing and Urban Development (HUD) data for 2019 50th-percentile rent estimates. Household income data and home-ownership data are from Census Housing Vacancies and Home-ownership data and 2019 Claritas estimates are based on Census data. Only counties with populations of 100,000 or greater are included in the top lists in this analysis.

About realtor.com®

Realtor.com® makes buying, selling and living in homes easier and more rewarding for everyone. Realtor.com® pioneered the world of digital real estate 20 years ago, and today through its website and mobile apps is a trusted source for the information, tools and professional expertise that help people move confidently through every step of their home journey. Using proprietary data science and machine learning technology,realtor.com® pairs buyers and sellers with local agents in their market, helping take the guesswork out of buying and selling a home. For professionals,realtor.com® is a trusted provider of consumer connections and branding solutions that help them succeed in today’s on-demand world. Realtor.com® is operated by News Corp [Nasdaq: NWS, NWSA] [ASX: NWS, NWSLV] subsidiary Move, Inc. under a perpetual license from the National Association of REALTORS®. For more information, visitrealtor.com®.

Media Contact
Cody Horvat – cody.horvat@move.com

5 Unnecessary Home Features When Buying a House

No one likes to overpay for a purchase, and this is particularly true when buying a home. After all, every square foot of space or block closer to a top school will cost you big-time! So if you’re a thrifty first time home buyer who must make every home-buying dollar count, check out these home features that often inspire sellers to jack up their price. That’s fine if you truly want these things, but if not? You’re wasting your money buying a house. See 3 more features that are a waste: https://www.realtor.com/advice/buy/va…

Renting A Home More Affordable Than Buying In 59 Percent Of U.S. Housing Markets

Home Prices Outpacing Wages in 80 Percent of the U.S. Housing Markets

Irvine, CA – Jan. 10, 2019 (PRNewswire) ATTOM Data Solutions, curator of the nation’s premier property database, today released its 2019 Rental Affordability Report, which shows that renting a three-bedroom property is more affordable than buying a median-priced home in 442 of 755 U.S. counties analyzed for the report — 59 percent.

ATTOM Logo

The analysis incorporated recently released fair market rent data for 2019 from the U.S. Department of Housing and Urban Development, wage data from the Bureau of Labor Statistics along with public record sales deed data from ATTOM Data Solutions in 755 U.S. counties with sufficient home sales data (see full methodology below).

“With rental affordability outpacing home affordability in the majority of U.S. housing markets, and home prices rising faster than rental rates, the American dream of owning a home, may be just that — a dream,” said Jennifer von Pohlmann, director of content and PR at ATTOM Data Solutions. “With home price appreciation increasing annually at an average of 6.7 percent in those counties analyzed for this report and rental rates increasing an average of 3.5 percent, coupled with the fact that home prices are outpacing wages in 80 percent of the counties, renting a home is clearly becoming the more attractive option in this volatile housing market.”

More Affordable to Rent Than Buy in Most U.S. Markets

More Affordable to Rent Than Buy in Most U.S. Markets

Renting more affordable than buying in nation’s most populated counties
Renting is more affordable than buying a home in the nation’s 18 most populated counties and in 37 of 40 counties with a population of 1 million or more (93 percent) — including Los Angeles County, California; Cook County (Chicago), Illinois; Harris County (Houston), Texas; Maricopa County (Phoenix), Arizona; and San Diego County, California.

Other markets with a population of more than 1 million where it is more affordable to rent than to buy a home included counties in Miami, New York City, Seattle, Las Vegas, San Jose, San Francisco and Boston.

Among the 40 U.S. counties analyzed in the report with a population of 1 million or more, the three where it is more affordable to buy a home than rent were Wayne County (Detroit), Michigan; Philadelphia County, Pennsylvania; and Cuyahoga County (Cleveland), Ohio.

Buy or Rent in 2019 Heat Map

Least affordable rental markets in Northern California, Hawaii, D.C.
The report shows that renting a three-bedroom property requires an average of 38.0 percent of weekly wages across the 755 counties analyzed for the report.

The least affordable markets for renting are Santa Cruz County, California (81.7 percent of average wages to rent); Honolulu County, Hawaii (74.4 percent); Spotsylvania County, Virginia (73.0 percent); Maui County, Hawaii (69.5 percent); San Benito County, California (68.6 percent); Monroe County, Florida (67.3 percent); Sonoma County (Santa Rosa area), California (66.0 percent); Marin County (San Francisco area), California (65.6 percent); and Kings County, New York (63.7 percent).

Most affordable rental markets in Ohio, North Carolina, Wisconsin, Pennsylvania
The most affordable markets for renting are Roane County (Knoxville area), Tennessee (19.7 percent of average wages to rent); Peoria County, Illinois (23.8 percent); Mcminn County (Athens), Tennessee (23.8 percent); Green County (Dayton), Ohio (24.2 percent); and Rhea County (Dayton area), Ohio (24.6 percent).

Among counties with a population of 1 million or more, those most affordable for renting are Allegheny County (Pittsburgh), Pennsylvania (25.1 percent); Cuyahoga County (Cleveland), Ohio (25.6 percent); Saint Louis County, Missouri (26.4 percent); Oakland County (Detroit area), Michigan (26.7 percent); and Wayne County (Detroit), Michigan (27.7 percent).

Rent growth outpacing wage growth in 52 percent of markets
Average fair market rents rose faster than average weekly wages in 394 of the 755 counties analyzed in the report (52 percent), including Los Angeles County, California; Cook County (Chicago), Illinois; Harris County (Houston), Texas; Maricopa County (Phoenix), Arizona; and San Diego County, California.

Average weekly wages rose faster than average fair market rents in 361 of the 755 counties analyzed in the report (48 percent), including Kings County (Brooklyn), New York; Queens County, New York; Clark County (Las Vegas), Nevada; Tarrant County (Dallas-Fort Worth), Texas; Santa Clara (San Jose), California; Broward County (Miami), Florida; and Alameda (San Francisco), California.

Home prices rising faster than wages in 80 percent of markets
Median home prices rose faster than average weekly wages in 601 of the 755 counties analyzed in the report (80 percent), including Los Angeles County, California; Cook County (Chicago), Illinois; Harris County (Houston), Texas; Maricopa County (Phoenix), Arizona; San Diego County, California; Orange County, California; and Miami-Dade County, Florida.

Average weekly wages rose faster than median home prices in 154 of the 755 counties analyzed in the report (20 percent), including Kings County (Brooklyn), New York; Queens County, New York; King County (Seattle), Washington; Suffolk County, New York; and Bronx County, New York.

Home prices rising faster than rents in 70 percent of markets
Median home prices rose faster than average fair market rents in 531 of the 755 counties analyzed in the report, including Cook County (Chicago), Illinois; Harris County (Houston), Texas; Maricopa County (Phoenix), Arizona; Kings County (Brooklyn), New York; Queens County, New York; and Riverside County, California.

Average fair market rents rose faster than median home prices in 224 of the 755 counties analyzed in the report (30 percent), including Los Angeles County, California; San Diego County, California; Orange County, California; Miami-Dade County, Florida; Dallas County, Texas; and Kings County (Seattle), Washington.

Methodology
For this report, ATTOM Data Solutions looked at 50th percentile average rental data for three-bedroom properties in 2018 from the U.S. Department of Housing and Urban Development, along with Q2 2018 average weekly wage data from the Bureau of Labor Statistics (most recent available) and January-November (YTD) 2018 home price data from ATTOM Data Solutions publicly recorded sales deed data in 755 counties nationwide.

Rental affordability is average fair market rent for a three-bedroom property as a percentage of the average monthly wage (based on average weekly wages). Home buying affordability is the monthly house payment for a median-priced home (based on a 3 percent down payment and including mortgage, property tax, homeowner’s insurance and private mortgage insurance) as a percentage of the average monthly wage.

About ATTOM Data Solutions
ATTOM Data Solutions provides premium property data to power products that improve transparency, innovation, efficiency and disruption in a data-driven economy. ATTOM multi-sources property tax, deed, mortgage, foreclosure, environmental risk, natural hazard, and neighborhood data for more than 155 million U.S. residential and commercial properties covering 99 percent of the nation’s population. A rigorous data management process involving more than 20 steps validates, standardizes and enhances the data collected by ATTOM, assigning each property record with a persistent, unique ID — the ATTOM ID. The 9TB ATTOM Data Warehouse fuels innovation in many industries including mortgage, real estate, insurance, marketing, government and more through flexible data delivery solutions that include bulk file licenses, APIs, market trends, marketing lists, match & append and more.

Media Contact:
Christine Stricker
(949) 748-8428
christine.stricker@attomdata.com

Data and Report Licensing:
(949) 502-8313
datareports@attomdata.com