Top 10 Metro Areas With the Largest Gains in Existing Single-family Home Prices in 2021 Q4

Source: nar.realtor

Per the National Association of REALTROS here is the top 10 metro areas with the largest gains in existing single-family home prices in 2021 Q4:

  1. Punta Gorda, FL
  2. Ocala, FL
  3. Austin/Round Rock, TX
  4. Phoenix/Mesa/Scottsdale, AZ
  5. Sherman/Denison, TX
  6. Tucson, AZ
  7. Las Vegas/Henderson/Paradise, NV
  8. Ogden/Clearfield, UT
  9. Salt Lake City, UT
  10. 10. Boise City/Nampa, ID

West Coast Sellers See Biggest Gains on Home Sales

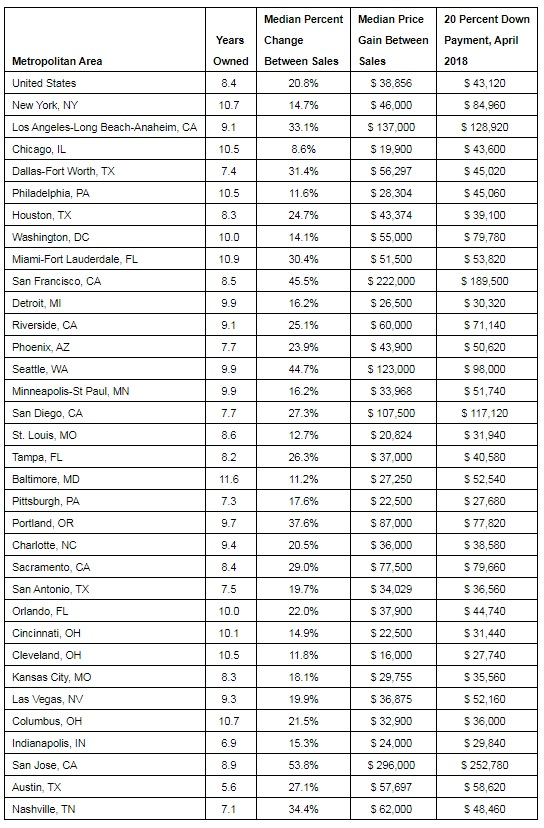
– Home sellers in San Jose sold their homes for 54 percent more than they paid, for a median gain of $296,000

– Nationally, home sellers in 2017 made about $39,000 after owning their homes for eight and a half years. That’s a profit of about 21 percent.

– San Jose, where sellers are making the biggest profits, is seeing the fastest home value appreciation and the biggest declines in inventory.

– Most sellers are also trying to buy another home at the same time they are selling.

Seattle, WA – June 26, 2018 (PRNewswire) Through 2017, the West Coast saw some of the biggest home value increases over the past decade, and home sellers are seeing big profits as a result.

Nationally, home sellers last year made nearly $39,000, or 21 percent, when compared with what they originally paid for the home, according to a Zillow® analysis(i). The typical seller had lived in their home for 8.4 years before selling it.

Zillow Logo

In San Jose, Calif., the typical home sold in 2017 earned the sellers 54 percent more than they originally paid for it nine years earlier, the highest profits of the metros analyzed. In the San Jose and San Francisco metros, sellers made more than the median value of a typical U.S. home.

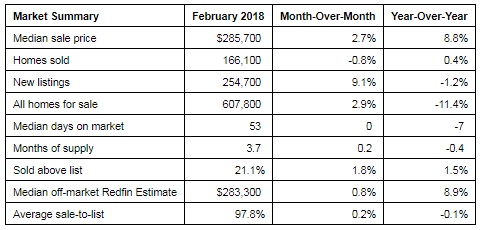
A short supply of homes for sale has kept upward pressure on home prices, especially in markets where available homes are hardest to find. The profits are welcome news for home sellers who are able to cash in on higher home prices, but demonstrate how difficult the market is for buyers. It is increasingly common for homes to sell for more than the listed price – in 2017, nearly a quarter of all homes sold for more than the asking price, up from 18 percent in 2012(ii).

“In a housing market that’s been plagued by low inventory and increasing demand, homeowners in the nation’s hottest markets have been able to cash in when they sell their homes,” said Zillow Senior Economist Aaron Terrazas. “A home is typically the biggest investment someone makes, and it’s paid off for longtime owners in many markets across the country. Today’s typical seller bought in 2010 – just before the national housing market bottomed out in 2012. Of course, these sellers typically are buyers as well, but the profits from the sale of their former home give them an advantage over first-time buyers who may be coming in with smaller down payments.”

Nashville sellers sold their homes for a median of 34 percent more than they paid for it, the fifth highest percent gain among the markets Zillow analyzed. They made these profits faster than markets where home sellers saw larger returns – sellers in markets that saw bigger gains than Nashville sellers had owned their homes for at least a year longer before selling.

Most sellers – 71 percent – are simultaneously trying to buy their next home(iii). In 25 of the markets analyzed, the profits sellers made are not enough for a 20 percent down payment on the median home in that same area. Sellers only made enough to cover a down payment in places where they saw the biggest percent gains on the sale.

Chart

Zillow

Zillow is the leading real estate and rental marketplace dedicated to empowering consumers with data, inspiration and knowledge around the place they call home, and connecting them with great real estate professionals. In addition, Zillow operates an industry-leading economics and analytics bureau led by Zillow Group’s Chief Economist Dr. Svenja Gudell. Dr. Gudell and her team of economists and data analysts produce extensive housing data and research covering more than 450 markets at Zillow Real Estate Research. Zillow also sponsors the quarterly Zillow Home Price Expectations Survey, which asks more than 100 leading economists, real estate experts and investment and market strategists to predict the path of the Zillow Home Value Index over the next five years. Launched in 2006, Zillow is owned and operated by Zillow Group, Inc. (NASDAQ: Z and ZG), and headquartered in Seattle.

Zillow is a registered trademark of Zillow, Inc.

(i) This analysis only looked at homes that were sold by individual sellers in 2017, and didn’t sell twice within a 60 day period. Only markets with at least 100 transactions were included.

(ii) https://www.zillow.com/research/home-sales-above-list-price-17875/

(iii) https://www.zillow.com/report/2017/sellers/typical-american-home-seller/


Redfin: Home Prices Post Strongest Gain in Nearly Four Years as a Double-Digit Inventory Decline Constrained Sales

Affordability Pressures Mount as Mortgage Rates Rise

Seattle, WA – March 15, 2018 (PRNewswire) (NASDAQ: RDFN) — Home prices increased 8.8 percent year over year in February, according to Redfin (www.redfin.com), the next-generation real estate brokerage. The median sale price was $285,700 across the markets Redfin serves. This was the strongest February for price appreciation since March 2014. February also marks six years, or 72 consecutive months, of year-over-year price increases since the market bottomed out and began to recover.

Redfin Logo

Constrained by a lack of supply, February home sales were nearly flat, up just 0.4 percent compared to last year. February saw an 11.4 percent decline in the overall number of homes for sale, marking the 29th consecutive month of year-over-year supply declines.

Notwithstanding affordability concerns and low inventory, buyer demand remained strong and market speed continued to increase. The typical home that sold last month went under contract in 53 days, a week faster than one year prior. More than one in five (21.1%) homes that sold last month went for more than their list price, up from 19.6 percent last February. Of the offers Redfin agents wrote for their clients in February, 56 percent encountered competition compared to 58 percent last February.

“Mortgage rates pushed upwards in February to the highest levels in nearly three years as home prices increased by their fastest pace since March 2014,” said Redfin Chief economist Nela Richardson. “A growing economy, healthy buyer demand and low inventory drove the ramp up in prices last month. Combining even slightly higher rates with price growth this strong will make it even more challenging for first-time buyers to find affordable homes to buy this year. The good news for sellers is modest rate increases are unlikely to curtail buyer demand. Just 6 percent of respondents to a survey commissioned by Redfin said they would cancel their home buying plans if rates rose above 5 percent.”

The median value of off-market homes was $283,300, as measured by the Redfin Estimate, up 8.9 percent from last year. 58.1 percent of homes on the market in February were priced above their Redfin Estimate value, with a Redfin-List-to-Estimate Ratio of 100.3 percent, indicating that sellers are slightly overpricing their homes.

Chart

Other February Highlights

Competition

  • Seattle, WA was the fastest market, with half of all homes pending sale in just 8 days, down from 12 days from a year earlier. Denver, CO and San Jose, CA were the next fastest markets with 9 and 10 median days on market, followed by Oakland, CA (13) and San Francisco, CA (14).
  • The most competitive market in February was San Jose, CA where 83.1% of homes sold above list price, followed by 74.4% in San Francisco, CA, 67.5% in Oakland, CA, 54.8% in Seattle, WA, and 44.4% in Tacoma, WA.

Prices

  • San Jose, CA had the nation’s highest price growth, rising 34.1% since last year to $1,180,000. Detroit, MI had the second highest growth at 19.8% year-over-year price growth, followed by Fresno, CA (19.5%), Tacoma, WA (17.9%), and New Orleans, LA (17.7%).
  • No metros saw price declines in February.

Sales

  • Long Island, NY saw the largest decline in sales since last year, falling 32.6%. Home sales in Minneapolis, MN and Miami, FL declined by 13.0% and 12.9%, respectively.
  • 6 out of 73 metros saw sales surge by double digits from last year. Louisville, KY led the nation in year-over-year sales growth, up 24.7%, followed by Greenville, SC, up 18.4%. Oklahoma City, OK rounded out the top three with sales up 15.8% from a year ago.

Inventory

  • Rochester, NY had the largest decrease in overall inventory, falling 40% since last February. Buffalo, NY (-39.6%), Atlanta, GA (-33.1%), and Albany, NY (-30.7%) also saw far fewer homes available on the market than a year ago.
  • Salt Lake City, UT had the highest increase in the number of homes for sale, up 49.9% year over year, followed by Baton Rouge, LA (31.8%) and Washington, DC (13.9%).

Redfin Estimate

  • The median list price-to-Redfin Estimate ratio was 93.3% in San Francisco, CA, the lowest of any market. This indicates the typical home for sale in February was listed at a price 6.7% below its estimated value. Only 8.1% of homes in San Francisco, CA were listed for more than their Redfin Estimate.
  • Conversely, the median list price-to-Redfin Estimate ratio was 102.6% in Miami, FL and 102.3% in West Palm Beach, FL, which means sellers are listing their homes for more than the estimated value in those metro areas. In Miami, FL, 86.4% of homes were listed above their Redfin Estimate, the highest percentage of any metro.

To read the full report, complete with data and charts, please visit the following link:
https://www.redfin.com/blog/2018/03/market-tracker-february-2018.html

About Redfin

Redfin (www.redfin.com) is the next-generation real estate brokerage, combining its own full-service agents with modern technology to redefine real estate in the consumer’s favor. Founded by software engineers, Redfin has the country’s #1 brokerage website and offers a host of online tools to consumers, including the Redfin Estimate, the automated home-value estimate with the industry’s lowest published error rate for listed homes. Homebuyers and sellers enjoy a full-service, technology-powered experience from Redfin real estate agents, while saving thousands in commissions. Redfin serves more than 80 major metro areas across the U.S. The company has closed more than $60 billion in home sales.