Quicken Loans Study: Less Than Half a Percent Difference Between Owner and Appraiser Opinions of Home Values

– Quicken Loans’ National HPPI shows appraised values 0.45% lower than homeowners estimated in December

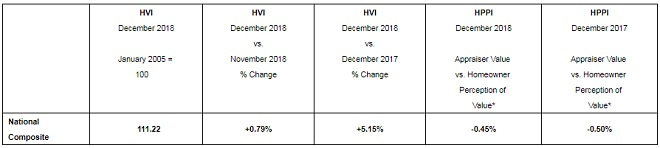
– Home values rose 0.79% nationally in December, and posted a 5.15% year-over-year increase, according to the Quicken Loans HVI

Detroit, MI – Jan. 8, 2019 (PRNewswire) The year ended with owner and appraiser perceptions of home values slightly moving in different directions, although the difference remains less than half a percent nationally. Appraisal values were an average of 0.45 percent lower than homeowners expected in December, according to the National Quicken Loans Home Price Perception Index (HPPI). This is compared to November, when there was just a 0.36 difference between the two data points.

Quicken Loans Logo

Despite the dip in perception, appraisal values themselves rose in December at a faster pace than they did in November. The National Quicken Loans Home Value Index (HVI) reported a 0.79 percent monthly increase in the average appraisal value. The national index also showed the average appraisal jumped 5.15 percent year-over-year.

Home Price Perception Index (HPPI)

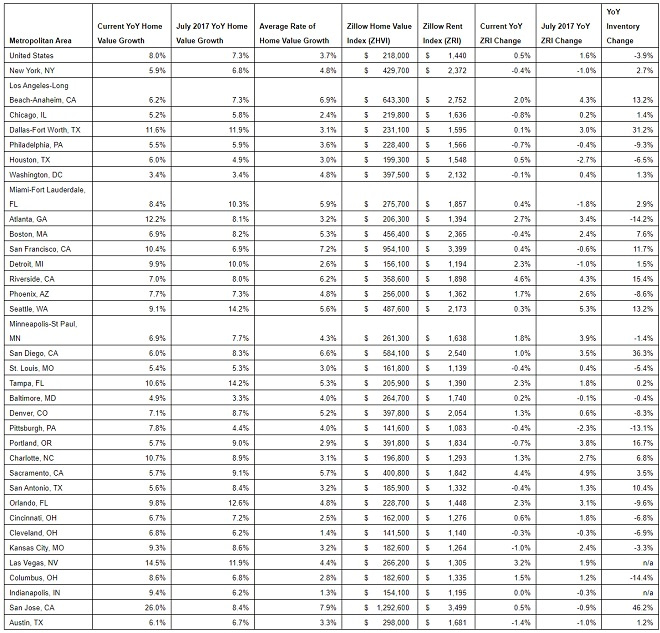
The HPPI – Quicken Loans’ exclusive measure of homeowners’ opinion of home values – continued to show a small difference between owners’ and appraisers’ opinions on a national level, but the appraisals in the vast majority of metro areas were higher than the owner expected in December. Homeowners in Boston, for example, saw appraisals coming back an average of 2.98 percent higher than what the homeowners expected. Based on the area’s median home value, that is an average of about $15,000 in extra equity the owners don’t realize they had.

“Many consumers don’t think about their home’s value until they start thinking about selling it. They may not be watching their local housing market as closely as appraisers who are reviewing home sales every day – leading the owners to incorrectly estimate their home’s value,” said Bill Banfield, Quicken Loans Executive Vice President of Capital Markets. “The fact of the matter is that the there are many ways a homeowner can make their equity can work for them if they have a realistic estimate of their home’s value. Tapping into home equity to consolidate high-interest debt, or make home improvements are very popular options right now.”

Home Value Index (HVI)

The Quicken Loans HVI, the only measure of home value change based exclusively on appraisal data, reported increasingly rising appraisal values across the country. The National HVI showed that home values rose steadily from November to December, increasing 0.79 percent. The annual growth is even stronger, with the average appraisal rising 5.15 percent over last year’s level. Another sign of the housing market’s health is that all four regions measured by the study reported modest growth on both the monthly and annual measures. The appraisal values ranged from 4.41 percent annual growth in the Northeast to a 5.98 percent year-over-year increase in the West.

“Any consumer who has read recent news about the housing market and has the impression that it is slowing to a halt should see that the HVI proves that this could not be farther from the truth,” said Banfield. “Home value growth is now at a more normal, sustainable clip – keeping pace with inflation and wage growth more than we have seen in the past few years.”

Chart

* A positive value represents appraiser opinions that are higher than homeowner perceptions. A negative value represents appraiser opinions that are lower than homeowner perceptions.

Chart

*A positive value represents appraiser opinions that are higher than homeowner perceptions. A negative value represents appraiser opinions that are lower than homeowner perceptions.

Chart

*A positive value represents appraiser opinions that are higher than homeowner perceptions. A negative value represents appraiser opinions that are lower than homeowner perceptions.

About the HPPI & HVI

The Quicken Loans HPPI represents the difference between appraisers’ and homeowners’ opinions of home values. The index compares the estimate that the homeowner supplies on a refinance mortgage application to the appraisal that is performed later in the mortgage process. This is an unprecedented report that gives a never-before-seen analysis of how homeowners are viewing the housing market. The HPPI national composite is determined by analyzing appraisal and homeowner estimates throughout the entire country, including data points from both inside and outside the metro areas specifically called out in the above report.

The Quicken Loans HVI is the only view of home value trends based solely on appraisal data from home purchases and mortgage refinances. This produces a wide data set and is focused on appraisals, one of the most important pieces of information to the mortgage process.

The HPPI and HVI are released on the second Tuesday of every month. Both of the reports are created with Quicken Loans’ propriety mortgage data from the 50-state lenders’ mortgage activity across all 3,000+ counties. The indexes are examined nationally, in four geographic regions and the HPPI is reported for 27 major metropolitan areas. All indexes, along with downloadable tables and graphs can be found at QuickenLoans.com/Indexes.

About Quicken Loans

Detroit-based Quicken Loans Inc. is the nation’s largest home mortgage lender. The company closed nearly half a trillion dollars of mortgage volume across all 50 states from 2013 through 2018. Quicken Loans moved its headquarters to downtown Detroit in 2010. Today, Quicken Loans and its Family of Companies employ more than 17,000 full-time team members in Detroit’s urban core. The company generates loan production from web centers located in Detroit, Cleveland and Phoenix. Quicken Loans also operates a centralized loan processing facility in Detroit, as well as its San Diego-based One Reverse Mortgage unit. Quicken Loans ranked highest in the country for customer satisfaction for primary mortgage origination by J.D. Power for the past nine consecutive years, 2010 – 2018, and also ranked highest in the country for customer satisfaction among all mortgage servicers the past five consecutive years, 2014 – 2018.

Quicken Loans was once again named to FORTUNE magazine’s “100 Best Companies to Work For” list in 2018 and has been included in the magazine’s top 1/3rd of companies named to the list for the past 15 consecutive years. In addition, Essence Magazine named Quicken Loans “#1 Place to Work in the Country for African Americans.”

Increase Your Homes Value with These Outdoor Features

Get the most out of your outdoor space during the warm months with these awesome added features. They’re not just an indulgence—they’re an investment! From an outdoor kitchen, to even an outdoor shower. These features will help increase your homes value.

See more ways to boost the value of your home on realtor.nar.

Home-Value Growth Slowing in Nation’s Hottest Housing Markets

– Seattle was leading the nation in home-value growth a year ago, but is now the 12th fastest-appreciating housing market and reported the greatest slowdown over the past year

– Annual home-value growth is slowing in 20 of the 35 largest U.S. housing markets, with Seattle and Tampa, Fla., reporting the greatest slowdown.

– U.S. home values rose 8 percent over the past year to a median of $218,000.

– The rental market is also showing signs of a slowdown. Median rent across the U.S. rose 0.5 percent since last July to $1,440, down from 1.6 percent growth a year ago.

– The number of homes for sale has been declining annually across the country for 42 straight months, with Columbus and Atlanta reporting the greatest drop in inventory over the past year.

Seattle, WA – Aug. 23, 2018 (PRNewswire) Home-value growth is slowing in almost two-thirds of the nation’s largest housing markets, according to the July Zillow® Real Estate Market Report(i). Seattle, Tampa, Sacramento, Calif., and Portland reported the greatest slowdown in home value appreciation over the past year.

Zillow Logo

Seattle, which led the nation in home-value growth a year ago(ii), is now the 12th fastest-appreciating housing market and reported the greatest slowdown over the past year. At this time last year, home values in Seattle were appreciating at more than 14 percent annually, but have now slowed to a 9 percent appreciation rate.

Home values across the U.S. rose 8 percent in the past year, 0.7 percentage points faster than the year before. While national home value growth hasn’t slowed yet, Zillow forecasts the annual appreciation rate to drop to 6.8 percent over the next 12 months. The median home value in the U.S. is $218,000, the highest value ever reported.

While home-value growth is slowing in the majority of the largest markets, the current annual appreciation rate is still higher than historical norms(iii) in all but four of the markets analyzed. In Tampa, where home-value growth has slowed significantly over the past year, home values rose over 10.5 percent in the past year, while the historic average rate of appreciation is just over 5 percent. The historic average annual rate of appreciation in the U.S. is 3.7 percent.

“The nation’s pricier markets are starting to feel an affordability squeeze as buyers begin to balk at the sustained, rapid rise in prices that have followed the strong job growth and high housing demand of the past half-decade,” said Zillow senior economist Aaron Terrazas. “But despite the slowdown, home values are still growing faster than their historic pace in almost all large markets, and it’s far too soon to call it a buyer’s market. And in many of the nation’s more affordable areas, aside from the pricey and exclusive San Francisco Bay Area, home value growth has perked up as buyers continue to seek good value for their money. But it’s clear that the winds that have boosted sellers over the past few years are ever-so-slightly starting to shift.”

The rental market is also showing signs of a slowdown. Median rent across the U.S. rose 0.5 percent over the past year to $1,440, down from 1.6 percent growth a year ago. Among the 35 largest housing markets, 21 reported slower rent appreciation in July compared to a year ago, with Seattle, Portland and Kansas City leading the slowdown.

Rental prices rose the most over the past year in Riverside, Calif., Sacramento and Las Vegas. Median rent in Riverside rose 4.6 percent since last July to $1,898. Median rent in Sacramento and Las Vegas rose 4.4 percent and 3.2 percent, respectively.

The number of homes for sale has been declining annually across the country for 42 straight months, although the pace of the decline is slowing. Home shoppers will have about 4 percent fewer homes on the market to choose from than a year ago – the smallest annual decline in 17 months. Columbus, Ohio, Atlanta and Pittsburgh reported the greatest drop in inventory over the past year. In Columbus and Atlanta, home shoppers will have about 14 percent fewer homes to choose from than a year ago, and about 13 percent fewer to choose from in Pittsburgh.

July ended with mortgage rates on Zillow(iv) at 4.40 percent, after starting the month at 4.35 percent. July mortgage rates peaked on the second to last day of the month at 4.42 percent, and hit a month low in the middle of the month(v) when rates were at 4.30 percent. Zillow’s real-time mortgage rates are based on thousands of custom mortgage quotes submitted daily to anonymous borrowers on the Zillow Mortgages site and reflect the most recent changes in the market.

Chart

Zillow

Zillow is the leading real estate and rental marketplace dedicated to empowering consumers with data, inspiration and knowledge around the place they call home, and connecting them with great real estate professionals. In addition, Zillow operates an industry-leading economics and analytics bureau led by Zillow Group’s Chief Economist Dr. Svenja Gudell. Dr. Gudell and her team of economists and data analysts produce extensive housing data and research covering more than 450 markets at Zillow Real Estate Research. Zillow also sponsors the quarterly Zillow Home Price Expectations Survey, which asks more than 100 leading economists, real estate experts and investment and market strategists to predict the path of the Zillow Home Value Index over the next five years. Launched in 2006, Zillow is owned and operated by Zillow Group, Inc. (NASDAQ: Z and ZG), and headquartered in Seattle.

Zillow is a registered trademark of Zillow, Inc.

(i) The Zillow Real Estate Market Reports are a monthly overview of the national and local real estate markets. The reports are compiled by Zillow Real Estate Research. For more information, visit www.zillow.com/research/. The data in Zillow’s Real Estate Market Reports are aggregated from public sources by a number of data providers for 928 metropolitan and micropolitan areas dating back to 1996. Mortgage and home loan data are typically recorded in each county and publicly available through a county recorder’s office. All current monthly data at the national, state, metro, city, ZIP code and neighborhood level can be accessed at www.zillow.com/local-info/ and www.zillow.com/research/data.

(ii) Seattle metro last led the nation in home value appreciation in June 2017, when home values there were appreciating 14.8 percent year-over-year.

(iii) Historical norms is referring to the average rate of appreciation.

(iv) Mortgage rates for a 30-year fixed mortgage.

(v) Month low was hit on July 18th.