
- Quicken Loans’ National HPPI shows appraised values 0.78% lower than homeowners estimated in March
- Home values dipped 0.20% nationally in March, but posted a 3.37% year-over-year increase, according to the Quicken Loans HVI
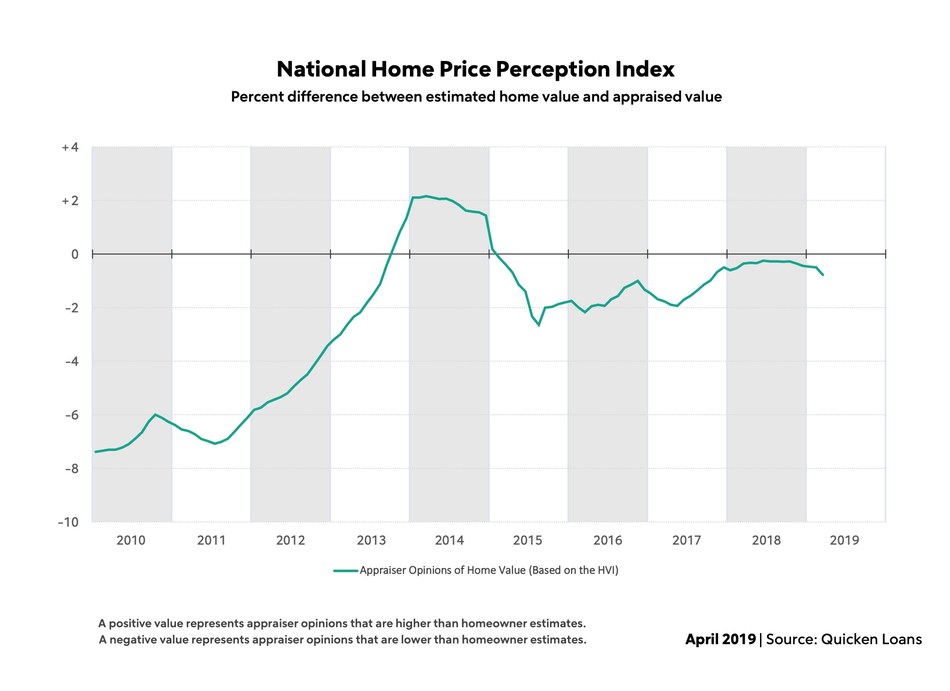
Detroit, MI – April 9, 2019 (PRNewswire) Homeowners’ average estimate of their home’s value stayed consistent in March, while appraised values dipped – widening the gap between the two more than 50 percent since February. In March, the average appraisal was 0.78 percent lower than homeowners expected, according to Quicken Loans’ National Home Price Perception Index (HPPI), compared to the previous month when appraisers’ opinions were 0.50 percent lower than what owners estimated.
Despite the widening of the difference between homeowners’ and appraisers’ opinion in the National HPPI, owners shouldn’t be too surprised in most of the country’s metro areas. Nearly 60% of the areas measured received appraisals that were within 1 percent higher or lower than what was expected. Boston remains the top of the area where appraisals are coming back higher than estimated. On the flipside, Chicago continues to remain at the bottom of the list with the average appraisal nearly 2 percent less than the homeowner expected.
“This month’s fluctuation in the HPPI was driven more by a dip in home values than a change in the owners’ viewpoint. Homeowners are often reluctant to believe their house has lowered in value, even at a slight monthly fluctuation,” said Banfield. “Depending on the area, appraised values are either growing at a much more measured pace, or have taken a step back from their meteoric rise. Homeowners are usually slower to realize change – in either direction – than the appraisers who study the market on a daily basis. This can lead to a slight widening of the perception gap when there is a turn in the market.”
The National Home Value Index (HVI) reported appraisal values dipped 0.20 percent from February to March. Home values continued to grow annually, rising 3.37 percent year-over-year. This is a slowdown from the growth in February, when appraised values rose 5.47 percent year-over year.
At a regional level, home values followed a similar blueprint – making minuscule monthly moves, and modest annual increases. The least-performing area was the South, with a 1.45 percent dip in appraisal values. The largest month-to-month growth was in the West, where home values increased 0.79 percent. The annual growth ranged from a 2.19 percent year-over-year increase in appraisal values in the West, to a 4.11 percent annual rise the Midwest. These are much more modest increases than we have seen over the last few years, but more in line with inflation and wage growth.
“Some of the rampant buyer demand that we’ve seen over the last few years has subsided because of the affordability issues many areas are having, driven by a lack of availability,” said Banfield. “Would-be buyers have decided to sit on the sidelines to see if more home inventory becomes available at the price-points where they’re shopping. The entire housing industry is watching to see what will happen in the coming months – whether owners and builders will provide the home inventory the buyers have been waiting for, amid the recent drop in interest rates.”
| HVIMarch 2019 January 2005 = 100 | HVIMarch 2019vs.February 2019% Change | HVIMarch 2019vs.March 2018% Change | HPPIMarch 2019 Appraiser Value vs. Homeowner Perception of Value* | HPPIMarch 2018 Appraiser Value vs. Homeowner Perception of Value* | |
| National Composite | 111.78 | -0.20% | +3.37% | -0.78% | -0.50% |
*A positive value represents appraiser opinions that are higher than homeowner perceptions. A negative value represents appraiser opinions that are lower than homeowner perceptions.
| Geographic Regions | HVIMarch 2019 January 2005 = 100 | HVIMarch 2019vs.February 2019% Change | HVIMarch 2019vs.March 2018% Change | HPPIMarch 2019 Appraiser Value vs. Homeowner Perception of Value* | HPPIMarch 2018 Appraiser Value vs. Homeowner Perception of Value* |
| West | 136.57 | +0.79% | +2.79% | -0.70% | -0.16% |
| South | 103.01 | -1.45% | +2.31% | -0.76% | -0.39% |
| Northeast | 113.52 | -0.19% | +3.65% | -0.78% | -0.44% |
| Midwest | 91.79 | +0.68% | +4.11% | -0.90% | -0.43% |
*A positive value represents appraiser opinions that are higher than homeowner perceptions. A negative value represents appraiser opinions that are lower than homeowner perceptions.
| MetropolitanAreas | HPPIMarch 2019 Appraiser Value vs. Homeowner Perception of Value* | HPPIFebruary 2019 Appraiser Value vs. Homeowner Perception of Value* | HPPIMarch 2018 Appraiser Value vs. Homeowner Perception of Value* |
| Boston, MA | +2.23% | +2.51% | +2.40% |
| Charlotte, NC | +2.11% | +2.10% | +1.22% |
| Denver, CO | +1.58% | +1.98% | +2.26% |
| Minneapolis, MN | +1.37% | +1.50% | +1.53% |
| San Jose, CA | +1.27% | +1.63% | +2.71% |
| Seattle, WA | +1.23% | +1.48% | +2.20% |
| Las Vegas, NV | +1.16% | +1.09% | +0.72% |
| Dallas, TX | +0.99% | +1.02% | +2.61% |
| Atlanta, GA | +0.81% | +0.93% | +0.06% |
| San Francisco, CA | +0.70% | +0.73% | +1.99% |
| San Diego, CA | +0.55% | +0.67% | +1.41% |
| Phoenix, AZ | +0.39% | +0.52% | +0.40% |
| Washington, D.C. | +0.31% | +0.57% | +0.46% |
| Portland, OR | +0.30% | +0.26% | +1.03% |
| Sacramento, CA | +0.28% | +0.46% | +0.72% |
| Kansas City, MO | +0.24% | +0.43% | +1.09% |
| Los Angeles, CA | -0.03% | +0.06% | +0.91% |
| New York, NY | -0.31% | -0.37% | +0.42% |
| Riverside, CA | -0.32% | -0.02% | +0.84% |
| Houston, TX | -0.47% | -0.48% | -0.92% |
| Tampa, FL | -0.59% | -0.57% | +0.21% |
| Miami, FL | -0.70% | -0.46% | +0.66% |
| Detroit, MI | -0.88% | -0.70% | +0.69% |
| Baltimore, MD | -1.08% | -1.12% | -1.18% |
| Philadelphia, PA | -1.42% | -1.38% | -1.62% |
| Cleveland, OH | -1.63% | -1.53% | -1.44% |
| Chicago, IL | -1.94% | -1.93% | -1.47% |
*A positive value represents appraiser opinions that are higher than homeowner perceptions. A negative value represents appraiser opinions that are lower than homeowner perceptions.
About the HPPI & HVI
The Quicken Loans HPPI represents the difference between appraisers’ and homeowners’ opinions of home values. The index compares the estimate that the homeowner supplies on a refinance mortgage application to the appraisal that is performed later in the mortgage process. This is an unprecedented report that gives a never-before-seen analysis of how homeowners are viewing the housing market. The HPPI national composite is determined by analyzing appraisal and homeowner estimates throughout the entire country, including data points from both inside and outside the metro areas specifically called out in the above report.
The Quicken Loans HVI is the only view of home value trends based solely on appraisal data from home purchases and mortgage refinances. This produces a wide data set and is focused on appraisals, one of the most important pieces of information to the mortgage process.
The HPPI and HVI are released on the second Tuesday of every month. Both of the reports are created with Quicken Loans’ propriety mortgage data from the 50-state lenders’ mortgage activity across all 3,000+ counties. The indexes are examined nationally, in four geographic regions and the HPPI is reported for 27 major metropolitan areas. All indexes, along with downloadable tables and graphs can be found at QuickenLoans.com/Indexes.
About Quicken Loans
Detroit-based Quicken Loans Inc. is the nation’s largest home mortgage lender. The company closed nearly half a trillion dollars of mortgage volume across all 50 states from 2013 through 2018. Quicken Loans moved its headquarters to downtown Detroit in 2010. Today, Quicken Loans and its Family of Companies employ more than 17,000 full-time team members in Detroit’s urban core. The company generates loan production from web centers located in Detroit, Cleveland and Phoenix. Quicken Loans also operates a centralized loan processing facility in Detroit, as well as its San Diego-based One Reverse Mortgage unit. Quicken Loans ranked highest in the country for customer satisfaction for primary mortgage origination by J.D. Power for the past nine consecutive years, 2010 – 2018, and also ranked highest in the country for customer satisfaction among all mortgage servicers the past five consecutive years, 2014 – 2018.
Quicken Loans was once again named to FORTUNE magazine’s “100 Best Companies to Work For” list in 2019 and has been included in the magazine’s top 1/3rd of companies named to the list for the past 16 consecutive years. In addition, Essence Magazine named Quicken Loans “#1 Place to Work in the Country for African Americans.”
For more information and company news visit QuickenLoans.com/press-room.