OneKey® MLS, reporting detailed, month-over-month statistical information about residential, condo, and co-op sales transactions in the regional MLS coverage area, reported 0.00% change in closed median sale price between October and November 2023.
Farmingdale, NY – Dec. 21, 2023 (PRNewswire) OneKey® MLS is the one source real estate marketplace for monthly statistics for residential real estate transactions from Montauk to Manhattan, north through the Hudson Valley and the Catskill Mountains. For November 2023, OneKey MLS reported a regional closed median sale price of $615,000, a 0.00% change as compared to the figure reported in October 2023. In a year-over-year comparison, the closed median sale price increased 7.00% from $575,000, reported in November 2022. Between October 2023 and November 2023, closed regional sales transactions, including residential, condo, and co-op sales, decreased 11.00% to 3,847 from 4,321. Year-over-year, transactions were down 17.7% from November 2022. Across the region, pending sales transactions decreased 10.70% in a month-over-month comparison, reportedly 3,828 in November 2023 as compared to 4,288 in October 2023. Year-over-year, pending residential sales were up 1.70% in November, from 3,763 the year prior.
OneKey® MLS, the largest MLS in New York, aggregates the real estate transactional data from nine counties making up the regional MLS coverage area, and reports individually on each county represented. The infographic demonstrates month-over-month closed median home price comparisons for the region.
Five of nine counties reported an increased closed median sale price in a month-over-month comparison, while two counties reported a decreased median sale price, and two reported no change. The Bronx (+11.20%), Putnam (+8.00 %), Orange (+2.50 %), Rockland (+2.00%), and Westchester (+0.80%) Counties reported month-over-month increases in closed median sale price. Nassau (-2.10%) and Sullivan (-4.2%) reported decreases in month-over-month residential sale price, while Suffolk and Queens Counties reported no change (±0.00%).
Table showing the change in closed median sale price for residential homes sold by county between October and November 2023 as reported on the NY-based regional multiple listing service OneKey MLS.
OneKey MLS CEO Richard Haggerty is optimistic about next year’s housing market, citing anticipated lower interest rates, which may increase bring more houses to market. “I think that we’re going to continue to see a downward trend with interest rates and that should really set the table for a much more robust 2024. Interest rates really affect sellers’ decisions more than buyers…”
About OneKey® MLS OneKey® MLS is one of the nation’s leading Multiple Listing Services, serving 48,000+ REALTOR® subscribers and 4,500 participating offices throughout Long Island, New York City, and the Hudson Valley. OneKey® MLS provides reliable property listing data, invaluable market insights, and an extensive suite of innovative industry tools and services.
Media Contact: Tricia Chirco, SVP Marketing and Communications, 631-670-0710 x405, 370368@email4pr.com
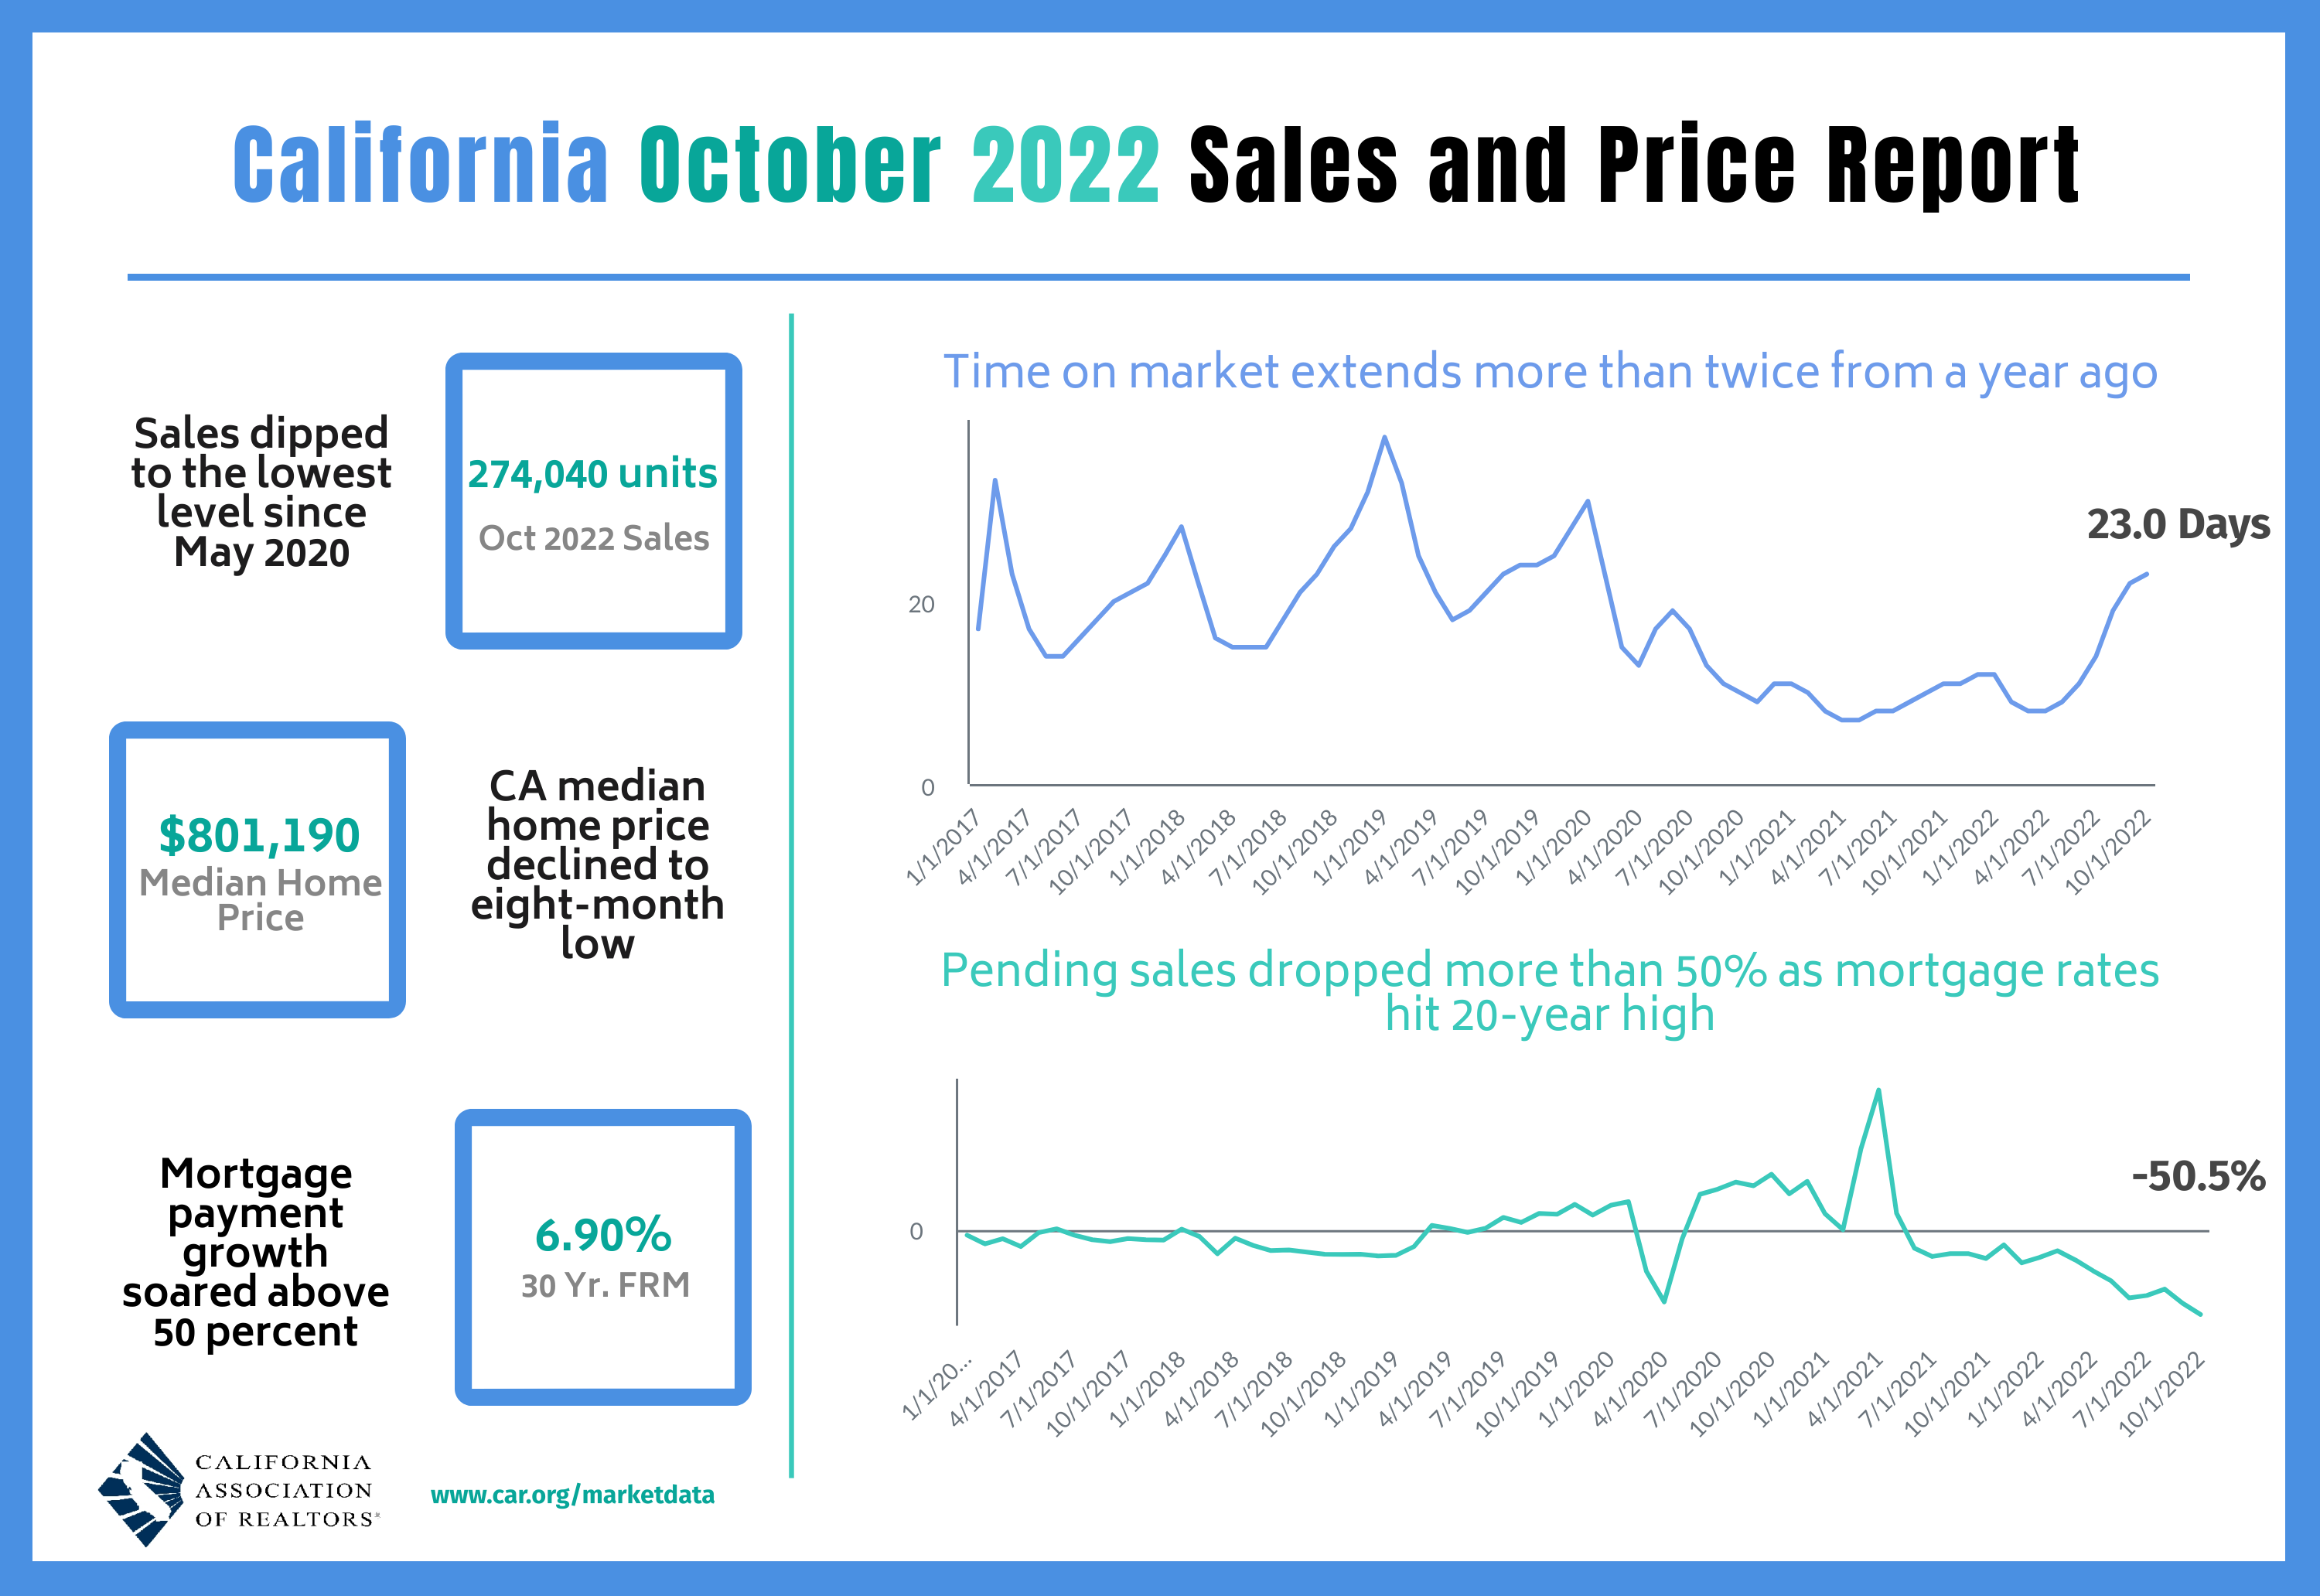
Existing, single-family home sales totaled 274,040 in October on a seasonally adjusted annualized rate, down 10.4 percent from September and down 36.9 percent from October 2021.
October’s statewide median home price was, $801,190 down 2.5 percent from September and up 0.3 percent from October 2021.
Year-to-date statewide home sales were down 18.5 percent in October.
Los Angeles, CA – Nov. 16, 2022 (PRNewswire) California’s housing market continued shifting in October as the monthly average 30-year fixed rate mortgage hovered near 7 percent and led to the lowest sales level since February 2008 and the largest year-over-year decline since December 2007, outside of the pandemic, the CALIFORNIA ASSOCIATION OF REALTORS® (C.A.R.) said today.
Closed escrow sales of existing, single-family detached homes in California totaled a seasonally adjusted annualized rate of 274,040 in October, according to information collected by C.A.R. from more than 90 local REALTOR® associations and MLSs statewide. The statewide annualized sales figure represents what would be the total number of homes sold during 2022 if sales maintained the October pace throughout the year. It is adjusted to account for seasonal factors that typically influence home sales. October’s sales pace was down 10.4 percent on a monthly basis from 305,680 in September and down 36.9 percent from a year ago, when 434,170 homes were sold on an annualized basis.
Home sales have been on a downward trend for 16 straight months on a year-over-year basis. It was the third time in the last four months that sales dropped more than 30 percent from the year-ago level. The monthly 10.4 percent sales decline was worse than the long-run average of +0.5 percent change recorded between a September and an October in the past 43 years. Sales in all price segments continued to drop by 30 percent or more year-over-year, with the $750,000-$999,000 price segment falling the most at 40.8 percent. The high-end market ($1 million-$1,999,000) experienced the smallest sales drop at 34.1 percent.
“While October’s sales and price results were weaker than what we’ve experienced in the past couple of years and could slow further in the upcoming off-season, the market bottom could be in sight,” said 2023 C.A.R. President Jennifer Branchini, a Bay Area REALTOR®. “Homes are still selling relatively quickly at 23 days on the market, one in four homes is selling above list price due to limited inventory, and with median price growth remaining positive in four of the five price segments, home prices are holding up reasonably well.”
California’s median home price declined 2.5 percent in October to $801,190 from the $821,680 recorded in September. The October price was 0.3 percent higher than the $798,440 recorded last October and was the smallest year-over-year price gain in 29 months. October marked the fifth consecutive month with a single-digit annual price increase. With the average 30-year fixed mortgage rate expected to remain above 6.5 percent for the rest of the year, home prices will moderate further in the coming months as affordability remains a challenge.
“Excluding the three-month pandemic lockdown period in spring 2020, October’s sales level was the lowest since February 2008. With pending sales showing a 50 percent drop from a year ago, we can expect additional tempering in housing demand in the coming months, as we previously forecasted,” said C.A.R. Vice President and Chief Economist Jordan Levine. “Home prices will also moderate further over the next several months as interest rates remain elevated in the near term and seasonal factors come into play.”
Other key points from C.A.R.’s October 2022 resale housing report include:
At the regional level, sales continued to fall sharply from last year, with four of the five major regions falling more than 35 percent from last year. Southern California had the biggest annual drop in sales at 40.8 percent, as every county within the region experienced a sales decline of more than 30 percent in October. The Central Coast (-38.8 percent), the San Francisco Bay Area (-37.3 percent) and the Central Valley (-36.4 percent) also posted sales declines of more than 35 percent from last year, with the declines worsening as borrowing costs continued to climb. The Far North (-19.1 percent) recorded the smallest sales declines of the five major regions, but it also has been dropping by double-digits for five straight months.
All but one California county recorded a year-over-year sales decline in October, with 41 of them plunging more than 20 percent from the like period a year ago. Madera (-52.4 percent) and Sutter (-52.4 percent) had the biggest sales drops of all counties, followed by San Bernardino (-47.9 percent), and Napa (-47.5 percent). Mariposa was the only county that did not experience an annual sales decline as sales in the county remained unchanged from last October.
More than half of all counties in California maintained positive year-over-year median-price growth in October. Prices were up from last year by double-digits in eight counties in October compared to five counties in the prior month. Santa Barbara (33.2 percent) had the biggest price increase of all counties, due primarily to a change in the mix of sales, followed by Lassen (24.9 percent) and Santa Cruz (19.9 percent). Twenty-two counties recorded a dip in their median price from a year ago, with Tehama dropping the most at -20.6 percent. Three other counties posted price declines in the double-digits, including Amador (-15.2 percent), Mariposa (-12.3 percent), and San Mateo (-10.0 percent).
With many potential buyers putting their home buying plans on hold, housing inventory in California rose month-to-month and year-to-year at the start of the fourth quarter. The statewide Unsold Inventory Index (UII) increased to 3.3 months in October 2022 from 2.9 months recorded in the prior month and from 1.8 months recorded in the same period a year ago. The UII increased in all price ranges by 75 percent or more from a year ago, with the $500,000 – $749,000 price range gaining the most (88.2 percent), followed by the $750,000 – $999,000 price range (83.3 percent), the $1 million and up (82.4 percent), and the sub- $500,000 (75.0 percent) segment.
Forty-seven of the 51 counties tracked by C.A.R. experienced an increase in active listings from last October, a slight dip from 48 counties recorded in September. Five counties registered a triple-digit, year-over-year gain in October with Yolo (113.0 percent) leading the pack, followed by Merced (106.8 percent), Marin (105.7 percent), Placer (104.0 percent), and Yuba (103.8 percent). Despite an overall improvement in the housing supply conditions, four counties experienced a contraction in active listings from last year. Del Norte continued to register the largest decline in October, with a drop of -48.8 percent year-over-year, followed by Mono (-33.3 percent), Plumas (-16.8 percent) and Siskiyou (-12.3 percent).
The median number of days it took to sell a California single-family home was 23 days in October and 11 days in October 2021.
C.A.R.’s statewide sales-price-to-list-price ratio* was 97.3 percent in October 2022 and 101.5 percent in October 2021.
The statewide average price per square foot** for an existing single-family home was $404, up from $389 in October a year ago.
The 30-year, fixed-mortgage interest rate averaged 6.90 percent in October, up from 3.07 percent in October 2021, according to Freddie Mac. The five-year, adjustable mortgage interest rate averaged 5.71 percent, compared to 2.54 percent in October 2021.
Note: The County MLS median price and sales data in the tables are generated from a survey of more than 90 associations of REALTORS® throughout the state and represent statistics of existing single-family detached homes only. County sales data is not adjusted to account for seasonal factors that can influence home sales. Movements in sales prices should not be interpreted as changes in the cost of a standard home. The median price is where half sold for more and half sold for less; medians are more typical than average prices, which are skewed by a relatively small share of transactions at either the lower end or the upper end. Median prices can be influenced by changes in cost, as well as changes in the characteristics and the size of homes sold. The change in median prices should not be construed as actual price changes in specific homes.
*Sales-to-list-price ratio is an indicator that reflects the negotiation power of home buyers and home sellers under current market conditions. The ratio is calculated by dividing the final sales price of a property by its last list price and is expressed as a percentage. A sales-to-list ratio with 100 percent or above suggests that the property sold for more than the list price, and a ratio below 100 percent indicates that the price sold below the asking price.
**Price per square foot is a measure commonly used by real estate agents and brokers to determine how much a square foot of space a buyer will pay for a property. It is calculated as the sale price of the home divided by the number of finished square feet. C.A.R. currently tracks price-per-square foot statistics for 50 counties.
Leading the way…® in California real estate for more than 110 years, the CALIFORNIA ASSOCIATION OF REALTORS® (www.car.org) is one of the largest state trade organizations in the United States with more than 217,000 members dedicated to the advancement of professionalism in real estate. C.A.R. is headquartered in Los Angeles.
October 2022 County Sales and Price Activity (Regional and condo sales data not seasonally adjusted)
October 2022
Median Sold Price of Existing Single-Family Homes
Sales
State/Region/County
Oct.2022
Sept.2022
Oct.2021
Price MTM% Chg
Price YTY% Chg
Sales MTM% Chg
Sales YTY% Chg
Calif. Single-family home
$801,190
$821,680
$798,440
-2.5 %
0.3 %
-10.4 %
-36.9 %
Calif. Condo/Townhome
$621,080
$620,000
$605,000
0.2 %
2.7 %
-12.5 %
-40.1 %
Los Angeles Metro Area
$742,570
$750,000
$725,000
-1.0 %
2.4 %
-12.2 %
-40.8 %
Central Coast
$937,500
$920,000
$865,420
1.9 %
8.3 %
-22.3 %
-38.8 %
Central Valley
$450,000
$456,000
$450,000
-1.3 %
0.0 %
-14.8 %
-36.4 %
Far North
$394,000
$380,000
$370,000
3.7 %
6.5 %
-10.0 %
-19.1 %
Inland Empire
$550,000
$562,240
$525,000
-2.2 %
4.8 %
-17.8 %
-44.1 %
San Francisco Bay Area
$1,250,000
$1,256,500
$1,275,000
-0.5 %
-2.0 %
-13.7 %
-37.3 %
Southern California
$773,810
$783,380
$750,000
-1.2 %
3.2 %
-12.9 %
-40.8 %
San Francisco Bay Area
Alameda
$1,250,000
$1,240,000
$1,280,000
0.8 %
-2.3 %
-15.1 %
-35.7 %
Contra Costa
$867,000
$882,000
$900,500
-1.7 %
-3.7 %
-16.0 %
-38.3 %
Marin
$1,662,500
$1,735,000
$1,685,000
-4.2 %
-1.3 %
-0.7 %
-15.6 %
Napa
$975,000
$987,000
$850,000
-1.2 %
14.7 %
-30.3 %
-47.5 %
San Francisco
$1,692,500
$1,650,000
$1,822,000
2.6 %
-7.1 %
7.4 %
-37.5 %
San Mateo
$1,900,000
$1,860,500
$2,110,000
2.1 %
-10.0 %
-17.6 %
-36.2 %
Santa Clara
$1,625,000
$1,700,000
$1,625,000
-4.4 %
0.0 %
-16.7 %
-39.5 %
Solano
$565,000
$587,000
$580,000
-3.7 %
-2.6 %
-18.6 %
-41.4 %
Sonoma
$797,570
$810,000
$750,000
-1.5 %
6.3 %
-3.0 %
-37.5 %
Southern California
Los Angeles
$854,280
$891,770
$848,970
-4.2 %
0.6 %
-6.1 %
-39.8 %
Orange
$1,165,000
$1,200,000
$1,120,000
-2.9 %
4.0 %
-17.6 %
-38.5 %
Riverside
$599,990
$600,000
$580,000
0.0 %
3.4 %
-19.2 %
-41.5 %
San Bernardino
$465,000
$480,000
$445,000
-3.1 %
4.5 %
-15.4 %
-47.9 %
San Diego
$860,000
$899,000
$850,000
-4.3 %
1.2 %
-15.6 %
-40.7 %
Ventura
$855,000
$850,000
$830,000
0.6 %
3.0 %
-1.5 %
-33.5 %
Central Coast
Monterey
$865,000
$822,500
$865,250
5.2 %
0.0 %
-20.5 %
-34.3 %
San Luis Obispo
$815,000
$875,000
$800,000
-6.9 %
1.9 %
-24.2 %
-39.2 %
Santa Barbara
$1,115,000
$905,000
$837,000
23.2 %
33.2 %
-21.4 %
-43.8 %
Santa Cruz
$1,362,000
$1,217,500
$1,136,000
11.9 %
19.9 %
-23.1 %
-35.9 %
Central Valley
Fresno
$400,000
$415,000
$385,000
-3.6 %
3.9 %
-22.0 %
-32.1 %
Glenn
$310,000
$327,000
$307,000
-5.2 %
1.0 %
-38.9 %
-15.4 %
Kern
$379,980
$365,000
$340,000
4.1 %
11.8 %
-11.6 %
-31.4 %
Kings
$328,000
$342,500
$325,000
-4.2 %
0.9 %
-6.1 %
-1.3 %
Madera
$400,000
$410,000
$394,880
-2.4 %
1.3 %
-15.4 %
-52.4 %
Merced
$380,000
$377,000
$370,000
0.8 %
2.7 %
-5.5 %
-35.8 %
Placer
$645,000
$645,000
$649,000
0.0 %
-0.6 %
-8.5 %
-27.1 %
Sacramento
$512,500
$520,000
$510,000
-1.4 %
0.5 %
-19.2 %
-43.9 %
San Benito
$761,000
$750,000
$768,000
1.5 %
-0.9 %
-14.0 %
-39.3 %
San Joaquin
$497,890
$515,000
$500,000
-3.3 %
-0.4 %
-20.9 %
-45.4 %
Stanislaus
$430,000
$445,000
$440,000
-3.4 %
-2.3 %
10.0 %
-24.5 %
Tulare
$369,000
$335,000
$325,000
10.1 %
13.5 %
-20.4 %
-33.4 %
Far North
Butte
$438,750
$429,780
$460,000
2.1 %
-4.6 %
-8.3 %
-14.7 %
Lassen
$290,500
$269,000
$232,500
8.0 %
24.9 %
-34.8 %
-46.4 %
Plumas
$442,500
$475,000
$470,000
-6.8 %
-5.9 %
-2.9 %
-8.1 %
Shasta
$382,250
$375,000
$359,500
1.9 %
6.3 %
-9.6 %
-23.8 %
Siskiyou
$326,750
$352,450
$329,500
-7.3 %
-0.8 %
-9.5 %
-5.0 %
Tehama
$272,500
$302,000
$343,000
-9.8 %
-20.6 %
-9.7 %
-3.4 %
Other Calif. Counties
Amador
$365,000
$400,000
$430,640
-8.8 %
-15.2 %
-11.8 %
-10.0 %
Calaveras
$414,500
$450,000
$432,000
-7.9 %
-4.1 %
-22.8 %
-40.8 %
Del Norte
$389,900
$418,750
$360,100
-6.9 %
8.3 %
18.8 %
-32.1 %
El Dorado
$684,000
$647,450
$615,000
5.6 %
11.2 %
-19.4 %
-23.2 %
Humboldt
$439,500
$460,000
$420,000
-4.5 %
4.6 %
13.0 %
-16.8 %
Lake
$353,000
$339,500
$345,000
4.0 %
2.3 %
12.5 %
-23.2 %
Mariposa
$399,000
$342,200
$455,000
16.6 %
-12.3 %
6.7 %
0.0 %
Mendocino
$530,000
$535,000
$534,000
-0.9 %
-0.7 %
-12.8 %
-25.5 %
Mono
$960,000
$1,105,000
$840,000
-13.1 %
14.3 %
-8.3 %
-31.3 %
Nevada
$532,500
$562,500
$525,000
-5.3 %
1.4 %
-30.1 %
-24.0 %
Sutter
$412,500
$437,850
$422,550
-5.8 %
-2.4 %
-25.9 %
-52.4 %
Tuolumne
$368,260
$399,500
$385,000
-7.8 %
-4.3 %
-17.0 %
-21.2 %
Yolo
$595,000
$635,000
$582,500
-6.3 %
2.1 %
-4.0 %
-30.7 %
Yuba
$405,000
$435,000
$413,000
-6.9 %
-1.9 %
17.5 %
-24.5 %
r = revised
October 2022 County Unsold Inventory and Days on Market (Regional and condo sales data not seasonally adjusted)