What’s at Stake in the Fresh Battle for Search Dominance

Source: Statista

The release of OpenAI’s conversational chatbot ChatGPT late last year set off the alarm bells at Google’s headquarters in Mountain View, California, as the company’s management viewed the nascent technology as a serious threat to its core search business. To make things worse, OpenAI, the company behind ChatGPT, is working closely with Microsoft, one of Google’s last remaining competitors in the search market (if you can even call it competition).

And sure enough, Google’s worst fears with respect to ChatGPT became reality on Tuesday, when Microsoft announced a new Bing running on a next-generation OpenAI model that is “more powerful than ChatGPT” and customized specifically for search. “AI will fundamentally change every software category, starting with the largest category of all – search,” Satya Nadella, Microsoft’s chairman and CEO, said in a statement, calling the AI-powered versions of Bing search and Edge browser “an AI copilot for the web.”

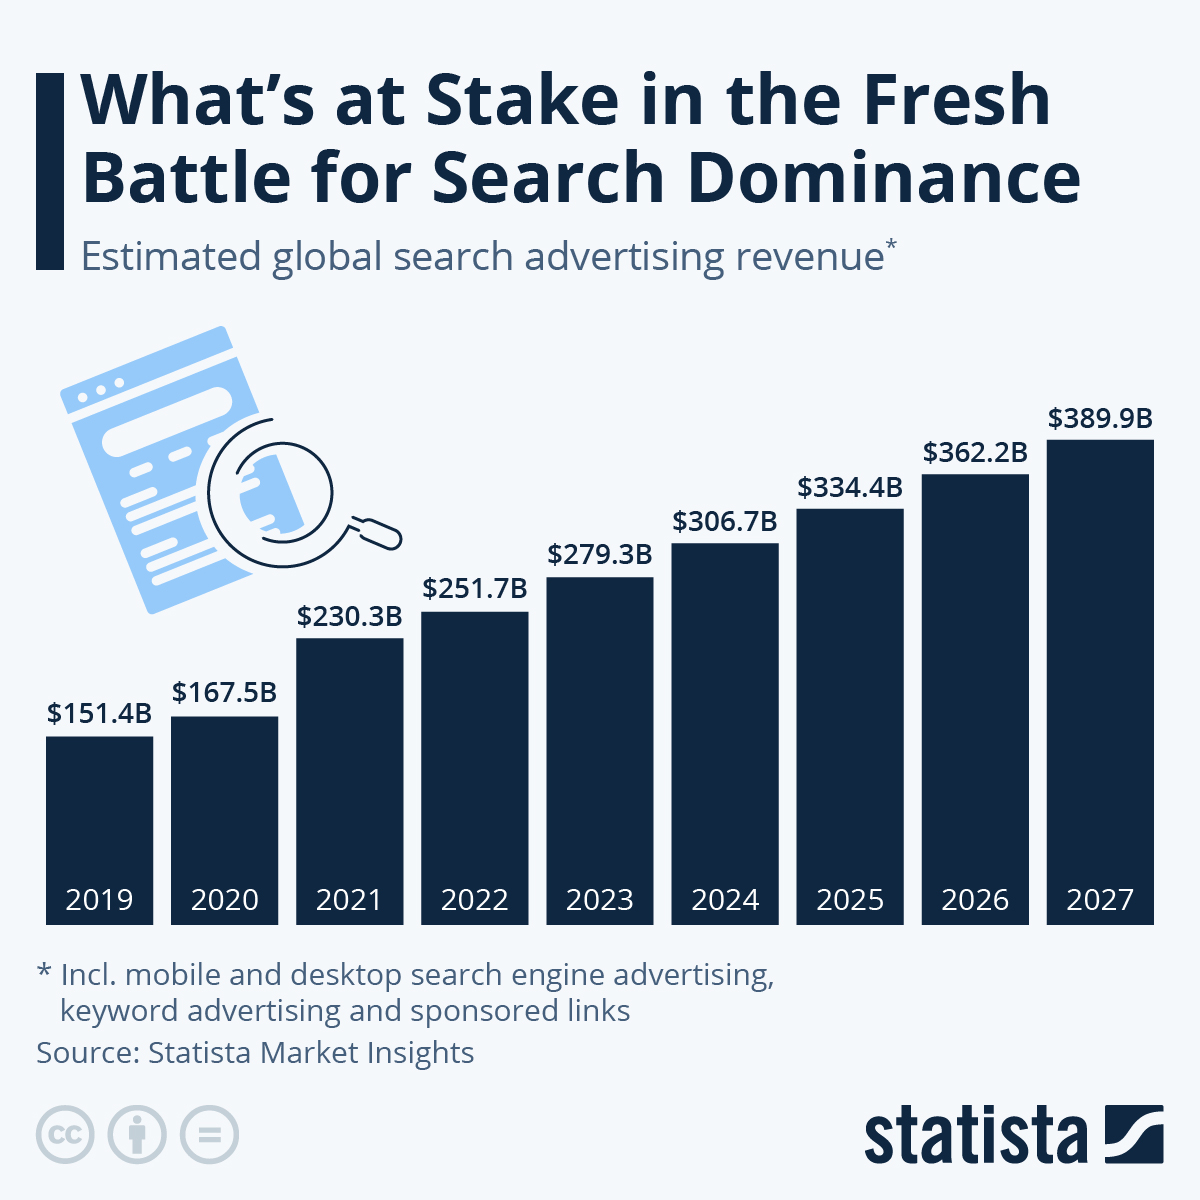
That announcement was arguably the most obvious attack on Google and its search business since the launch of Bing in 2009. And while one could argue that Bing’s arrival hardly made a dent in Google’s dominance, this time things feel differently, as technological shifts have often coincided with shifts in the balance of power – just ask Nokia. But even if Google successfully manages to defend its dominant position in the search market, losing just a couple of percentage points in market share would translate into billions of dollars in lost advertising revenue. According to estimates from Statista’s Digital Market Insights, global search advertising revenue amounted to $260 billion last year and could climb to $400 billion by 2026.

Infographic: What's at Stake in the Fresh Battle for Search Dominance | Statista

Backlinks Are Not Dead – Infographic

We hear about changes to Google ranking algorithms all the time. While the field of SEO has evolved a lot over the years, backlinks remain very important. This infographic from DIR Journal covers what makes a good link:

https://googleads.g.doubleclick.net/pagead/ads?client=ca-pub-9951566236021307&output=html&h=280&slotname=2593660373&adk=2691882389&adf=3313208526&pi=t.ma~as.2593660373&w=760&fwrn=4&fwrnh=100&lmt=1615331907&rafmt=3&psa=1&format=760×280&url=https%3A%2F%2Fwww.best-infographics.com%2Flinks-are-not-dead%2F&flash=0&fwr=0&rpe=1&resp_fmts=1&wgl=1&adsid=ChAIgNacggYQoYLUtJLCsb42Ej0AAjT3AKe18uk-98RL7ZYUrlGG8YLQy-pj2MBVH1sMraPXsigFq4SM5wsNASyCWXfispjunZdH05TDsV4c&dt=1615331891634&bpp=33&bdt=879&idt=775&shv=r20210304&cbv=r20190131&ptt=9&saldr=aa&abxe=1&cookie=ID%3D6b36f2c82932462d-22a552675cc500fb%3AT%3D1608245691%3ART%3D1608245691%3AS%3DALNI_MYfCaddjuq8y4nZFIxq7RmjGvu0VQ&prev_fmts=1200×280%2C300x600%2C0x0&nras=1&correlator=3909430333795&frm=20&pv=1&ga_vid=520178792.1608245690&ga_sid=1615331892&ga_hid=1379275549&ga_fc=0&u_tz=-300&u_his=8&u_java=0&u_h=1080&u_w=1920&u_ah=1050&u_aw=1920&u_cd=24&u_nplug=3&u_nmime=4&adx=492&ady=4942&biw=1903&bih=947&scr_x=0&scr_y=1189&eid=44735931%2C21066428%2C21066923&oid=3&psts=AGkb-H_CLX-lIRRc9v5uPCFn6zl_wiMf989V3pxpw7eSiacm-BHKVTBjYWCBfaAmUqGC-9vLpeMOinRu2A%2CAGkb-H-3I8HnJmsc6cWSU06NLAYtJBNKGaPuKWgkUPSb4wpq6FZYgXxm6IyjPLYcroVavmFs6HW9eg_uM-76Dg&pvsid=3162230210371677&pem=121&ref=https%3A%2F%2Fwww.best-infographics.com%2F&rx=0&eae=0&fc=896&brdim=-1920%2C-12%2C-1920%2C-12%2C1920%2C-12%2C1920%2C1050%2C1920%2C947&vis=1&rsz=%7C%7CoeEbr%7C&abl=CS&pfx=0&fu=8320&bc=31&jar=2021-03-09-23&ifi=2&uci=a!2&btvi=1&fsb=1&xpc=FEymtTvrTq&p=https%3A//www.best-infographics.com&dtd=15626

Your Small Business Guide to Google Analytics – Infographic

If you have ever asked:

  • How many people are visiting my Website?
  • What channel brings them there?
  • Which pages are the most and least popular?
  • How long do users stay on the site?

it’s likely that Google Analytics has the answer. If you haven’t asked these questions you should be.

We recently blogged about Google Analytics and AgencyLogic Single Property Websites and the following infographic (from Headway Capital) provides more information.

Courtesy of: Headway Capital