Sunday’s Football Rematch: A Tale of Two Cities’ Home Prices Since 2005

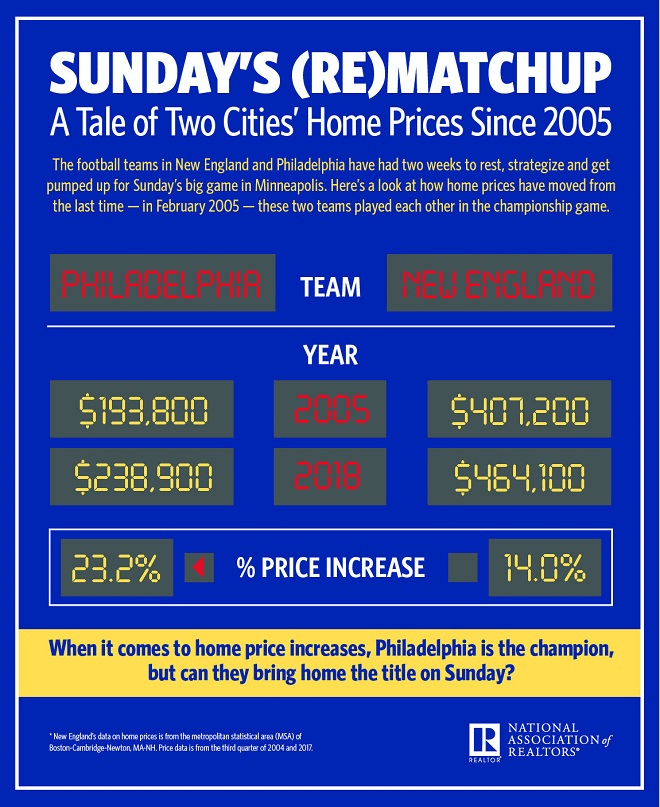
Washington, D.C. – Feb. 2, 2018 (PRNewswire) The New England Patriots and Philadelphia Eagles have had two weeks to rest, strategize and get pumped up for Sunday’s big game in Minneapolis. Here’s a look at how home prices have moved from the last time – in February 2005 – these two teams played each other in the championship game:

NAR Logo

When it comes to home price increases, Philadelphia is the champion, but can they bring home the title on Sunday?

*New England’s data on home prices is from the metropolitan statistical area (MSA) of Boston-Cambridge-Newton, MA-NH. Price data is from the third quarter of 2004 and 2017.

Real Estate Infographic

The National Association of Realtors®, “The Voice for Real Estate,” is America’s largest trade association, representing 1.3 million members involved in all aspects of the residential and commercial real estate industries.

The Super Bowl and Metro Home Prices

Think you know which team is going to win the Super Bowl this weekend? How do their metro area home prices stack up? This infographic takes a look.

The data in this infographic comes from NAR’s Metropolitan Median Area Prices and Affordability statistics.

Super Bowl and Metro Home Prices Infographic

Do Real Estate Prices Influence Super Bowl Appearances?

Source: RealEstate.com

Andy Fulton at RealEstate.com compared the number of times NFL teams appeared in the Super Bowl and the price of property in their home city. He discovered:

“Of the 10 NFL teams that have appeared in the Super Bowl the most, seven are from cities with high median home prices, when compared to the national median home price. The opposite is also true; the 10 teams that have been to the Super Bowl the least, if they have even gone at all, generally come from cities with low median home prices.”