– Seattle was leading the nation in home-value growth a year ago, but is now the 12th fastest-appreciating housing market and reported the greatest slowdown over the past year
– Annual home-value growth is slowing in 20 of the 35 largest U.S. housing markets, with Seattle and Tampa, Fla., reporting the greatest slowdown.
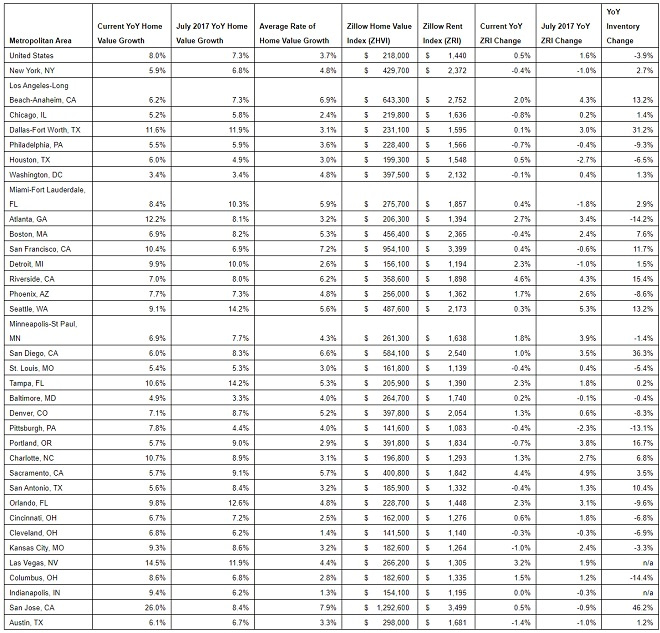
– U.S. home values rose 8 percent over the past year to a median of $218,000.
– The rental market is also showing signs of a slowdown. Median rent across the U.S. rose 0.5 percent since last July to $1,440, down from 1.6 percent growth a year ago.
– The number of homes for sale has been declining annually across the country for 42 straight months, with Columbus and Atlanta reporting the greatest drop in inventory over the past year.
Seattle, WA – Aug. 23, 2018 (PRNewswire) Home-value growth is slowing in almost two-thirds of the nation’s largest housing markets, according to the July Zillow® Real Estate Market Report(i). Seattle, Tampa, Sacramento, Calif., and Portland reported the greatest slowdown in home value appreciation over the past year.

Seattle, which led the nation in home-value growth a year ago(ii), is now the 12th fastest-appreciating housing market and reported the greatest slowdown over the past year. At this time last year, home values in Seattle were appreciating at more than 14 percent annually, but have now slowed to a 9 percent appreciation rate.
Home values across the U.S. rose 8 percent in the past year, 0.7 percentage points faster than the year before. While national home value growth hasn’t slowed yet, Zillow forecasts the annual appreciation rate to drop to 6.8 percent over the next 12 months. The median home value in the U.S. is $218,000, the highest value ever reported.
While home-value growth is slowing in the majority of the largest markets, the current annual appreciation rate is still higher than historical norms(iii) in all but four of the markets analyzed. In Tampa, where home-value growth has slowed significantly over the past year, home values rose over 10.5 percent in the past year, while the historic average rate of appreciation is just over 5 percent. The historic average annual rate of appreciation in the U.S. is 3.7 percent.
“The nation’s pricier markets are starting to feel an affordability squeeze as buyers begin to balk at the sustained, rapid rise in prices that have followed the strong job growth and high housing demand of the past half-decade,” said Zillow senior economist Aaron Terrazas. “But despite the slowdown, home values are still growing faster than their historic pace in almost all large markets, and it’s far too soon to call it a buyer’s market. And in many of the nation’s more affordable areas, aside from the pricey and exclusive San Francisco Bay Area, home value growth has perked up as buyers continue to seek good value for their money. But it’s clear that the winds that have boosted sellers over the past few years are ever-so-slightly starting to shift.”
The rental market is also showing signs of a slowdown. Median rent across the U.S. rose 0.5 percent over the past year to $1,440, down from 1.6 percent growth a year ago. Among the 35 largest housing markets, 21 reported slower rent appreciation in July compared to a year ago, with Seattle, Portland and Kansas City leading the slowdown.
Rental prices rose the most over the past year in Riverside, Calif., Sacramento and Las Vegas. Median rent in Riverside rose 4.6 percent since last July to $1,898. Median rent in Sacramento and Las Vegas rose 4.4 percent and 3.2 percent, respectively.
The number of homes for sale has been declining annually across the country for 42 straight months, although the pace of the decline is slowing. Home shoppers will have about 4 percent fewer homes on the market to choose from than a year ago – the smallest annual decline in 17 months. Columbus, Ohio, Atlanta and Pittsburgh reported the greatest drop in inventory over the past year. In Columbus and Atlanta, home shoppers will have about 14 percent fewer homes to choose from than a year ago, and about 13 percent fewer to choose from in Pittsburgh.
July ended with mortgage rates on Zillow(iv) at 4.40 percent, after starting the month at 4.35 percent. July mortgage rates peaked on the second to last day of the month at 4.42 percent, and hit a month low in the middle of the month(v) when rates were at 4.30 percent. Zillow’s real-time mortgage rates are based on thousands of custom mortgage quotes submitted daily to anonymous borrowers on the Zillow Mortgages site and reflect the most recent changes in the market.

Zillow
Zillow is the leading real estate and rental marketplace dedicated to empowering consumers with data, inspiration and knowledge around the place they call home, and connecting them with great real estate professionals. In addition, Zillow operates an industry-leading economics and analytics bureau led by Zillow Group’s Chief Economist Dr. Svenja Gudell. Dr. Gudell and her team of economists and data analysts produce extensive housing data and research covering more than 450 markets at Zillow Real Estate Research. Zillow also sponsors the quarterly Zillow Home Price Expectations Survey, which asks more than 100 leading economists, real estate experts and investment and market strategists to predict the path of the Zillow Home Value Index over the next five years. Launched in 2006, Zillow is owned and operated by Zillow Group, Inc. (NASDAQ: Z and ZG), and headquartered in Seattle.
Zillow is a registered trademark of Zillow, Inc.
(i) The Zillow Real Estate Market Reports are a monthly overview of the national and local real estate markets. The reports are compiled by Zillow Real Estate Research. For more information, visit www.zillow.com/research/. The data in Zillow’s Real Estate Market Reports are aggregated from public sources by a number of data providers for 928 metropolitan and micropolitan areas dating back to 1996. Mortgage and home loan data are typically recorded in each county and publicly available through a county recorder’s office. All current monthly data at the national, state, metro, city, ZIP code and neighborhood level can be accessed at www.zillow.com/local-info/ and www.zillow.com/research/data.
(ii) Seattle metro last led the nation in home value appreciation in June 2017, when home values there were appreciating 14.8 percent year-over-year.
(iii) Historical norms is referring to the average rate of appreciation.
(iv) Mortgage rates for a 30-year fixed mortgage.
(v) Month low was hit on July 18th.
Like this:
Like Loading...