- Overall Mortgage Delinquency Rate Fell 0.1 Percentage Points Year Over Year
- Foreclosure Rate Declined 0.2 Percentage Points Year Over Year
- Transition Rates for 60-Day and 90-Day Delinquency Rose Sharply in Texas and Florida Likely Due to 2017 Hurricanes
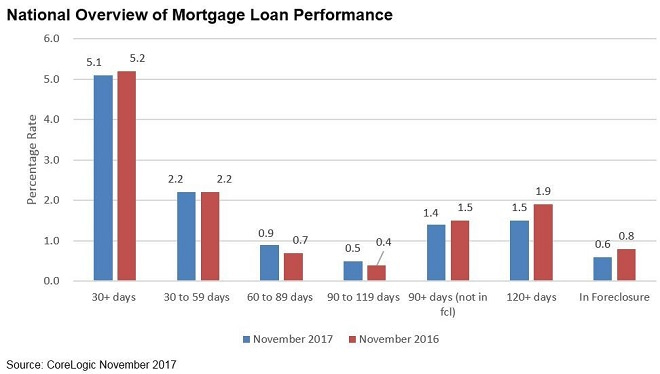
IRVINE, CA – February 13, 2018 (BUSINESS WIRE) CoreLogic® (NYSE: CLGX), a leading global property information, analytics and data-enabled solutions provider, today released its monthly Loan Performance Insights Report which shows that, nationally, 5.1 percent of mortgages were in some stage of delinquency (30 days or more past due including those in foreclosure) in November 2017. This represents a 0.1 percentage point year-over-year decline in the overall delinquency rate compared with November 2016 when it was 5.2 percent.
![]()

As of November 2017, the foreclosure inventory rate, which measures the share of mortgages in some stage of the foreclosure process, was 0.6 percent, down 0.2 percentage points from 0.8 percent in November 2016. The foreclosure inventory rate has held steady at 0.6 percent since August 2017, the lowest level since June 2007 when it was also at 0.6 percent. This past November’s foreclosure inventory rate was the lowest for the month of November in 11 years, since it was also 0.6 percent in November 2006.
Measuring early-stage delinquency rates is important for analyzing the health of the mortgage market. To monitor mortgage performance comprehensively, CoreLogic examines all stages of delinquency as well as transition rates, which indicate the percentage of mortgages moving from one stage of delinquency to the next.
The rate for early-stage delinquencies, defined as 30-59 days past due, was 2.2 percent in November 2017, down 0.1 percentage points from 2.3 percent in October 2017 and unchanged from 2.2 percent in November 2016. The share of mortgages that were 60-89 days past due in November 2017 was 0.9 percent, unchanged from October 2017 and up from 0.7 percent in November 2016. The serious delinquency rate, reflecting loans 90 days or more past due, was 2.0 percent in November 2017, up from 1.9 percent in October 2017 and down from 2.3 percent in November 2016. Prior to November 2017, the serious delinquency rate had held steady for five consecutive months at 1.9 percent—the lowest level for any month since October 2007 when it was also 1.9 percent.
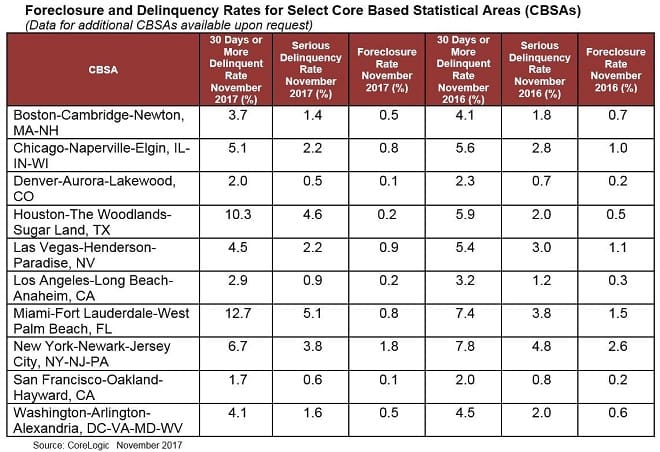
“The effects of Hurricanes Harvey, Irma and Maria appear clearly in our mortgage delinquency report,” said Dr. Frank Nothaft, chief economist for CoreLogic. “Serious delinquency rates are up sharply in Texas and Florida compared with a year ago, while lower in all other states except Alaska. In Puerto Rico, the serious delinquency rate jumped to 6.3 percent in November, up 2.7 percentage points compared with a year before. In the Miami metropolitan area, serious delinquency was up more than one-third from one year earlier to 5.1 percent, and it more than doubled to 4.6 percent in the Houston area.”

Since early-stage delinquencies can be volatile, CoreLogic also analyzes transition rates. The share of mortgages that transitioned from current to 30 days past due was 1 percent in November 2017, down from 1.1 percent in October 2017 and unchanged from 1 percent in November 2016. By comparison, in January 2007, just before the start of the financial crisis, the current-to-30-day transition rate was 1.2 percent and it peaked in November 2008 at 2 percent.
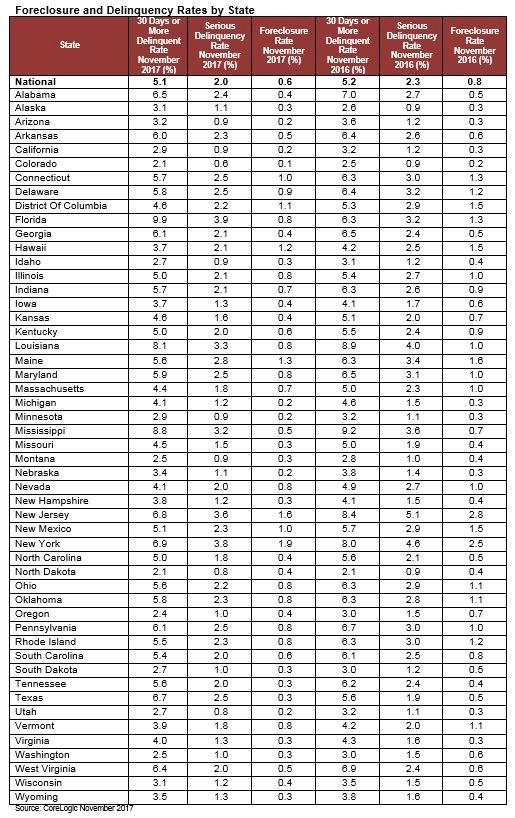

“Transition rates for 60-day and 90-day delinquency, while stable across most of the country, were up sharply in many areas impacted by the 2017 hurricanes,” said Frank Martell, president and CEO of CoreLogic. “In many of the harder-hit regions, such as the Houston and Miami metropolitan areas, housing stock availability has taken a hit as many homes were damaged and are no longer habitable. As a result, we expect to see further upward pressure on prices and rents for habitable homes, which will continue to erode affordability.”

For ongoing housing trends and data, visit the CoreLogic Insights Blog: www.corelogic.com/blog.
Methodology
The data in this report represents foreclosure and delinquency activity reported through November 2017.
The data in this report accounts for only first liens against a property and does not include secondary liens. The delinquency, transition and foreclosure rates are measured only against homes that have an outstanding mortgage. Homes without mortgage liens are not typically subject to foreclosure and are, therefore, excluded from the analysis. Approximately one-third of homes nationally are owned outright and do not have a mortgage. CoreLogic has approximately 85 percent coverage of U.S. foreclosure data.
Source: CoreLogic
The data provided is for use only by the primary recipient or the primary recipient’s publication or broadcast. This data may not be re-sold, republished or licensed to any other source, including publications and sources owned by the primary recipient’s parent company without prior written permission from CoreLogic. Any CoreLogic data used for publication or broadcast, in whole or in part, must be sourced as coming from CoreLogic, a data and analytics company. For use with broadcast or web content, the citation must directly accompany first reference of the data. If the data is illustrated with maps, charts, graphs or other visual elements, the CoreLogic logo must be included on screen or website. For questions, analysis or interpretation of the data, contact Lori Guyton at lguyton@cvic.com or Bill Campbell at bill@campbelllewis.com. Data provided may not be modified without the prior written permission of CoreLogic. Do not use the data in any unlawful manner. This data is compiled from public records, contributory databases and proprietary analytics, and its accuracy is dependent upon these sources.
About CoreLogic
CoreLogic (NYSE: CLGX) is a leading global property information, analytics and data-enabled solutions provider. The company’s combined data from public, contributory and proprietary sources includes over 4.5 billion records spanning more than 50 years, providing detailed coverage of property, mortgages and other encumbrances, consumer credit, tenancy, location, hazard risk and related performance information. The markets CoreLogic serves include real estate and mortgage finance, insurance, capital markets, and the public sector. CoreLogic delivers value to clients through unique data, analytics, workflow technology, advisory and managed services. Clients rely on CoreLogic to help identify and manage growth opportunities, improve performance and mitigate risk. Headquartered in Irvine, Calif., CoreLogic operates in North America, Western Europe and Asia Pacific. For more information, please visit www.corelogic.com.
CORELOGIC and the CoreLogic logo are trademarks of CoreLogic, Inc. and/or its subsidiaries.
Contacts
For CoreLogic
For real estate industry and trade media:
Bill Campbell
(212) 995-8057
bill@campbelllewis.com
or
For general news media:
Lori Guyton
(901)277-6066
lguyton@cvic.com