
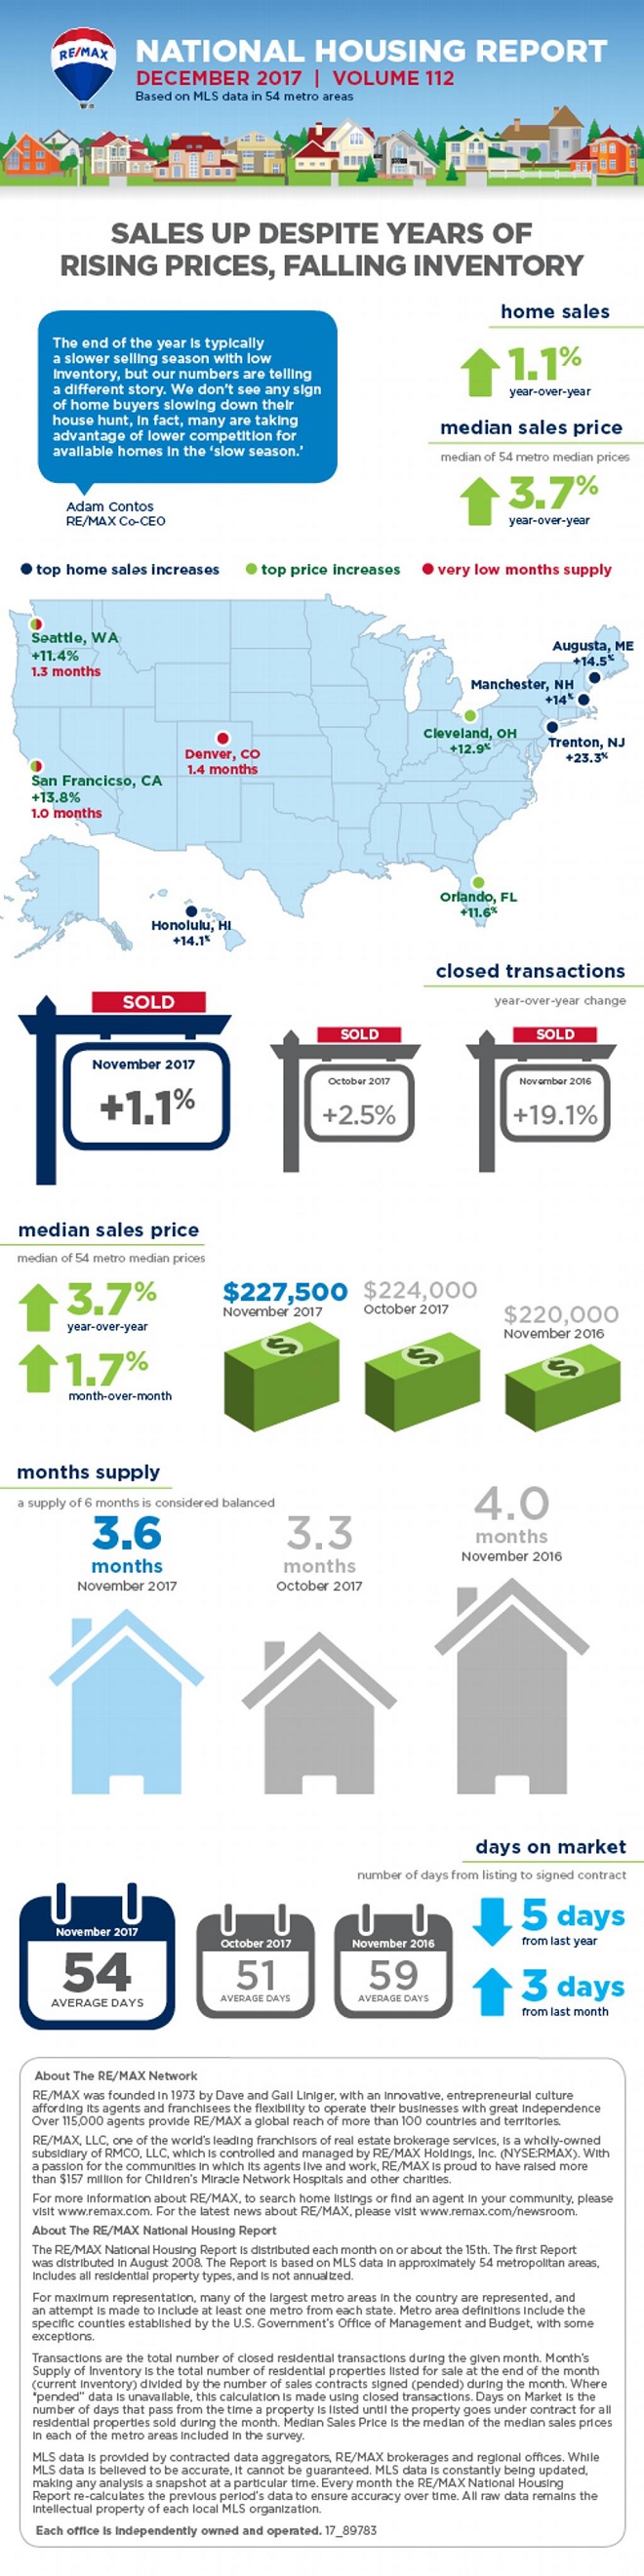
The December 2017 RE/MAX National Housing Report infographic shows housing market trends throughout 54 metro areas. The report is based on MLS information, includes all residential properties and is not annualized.


The December 2017 RE/MAX National Housing Report infographic shows housing market trends throughout 54 metro areas. The report is based on MLS information, includes all residential properties and is not annualized.