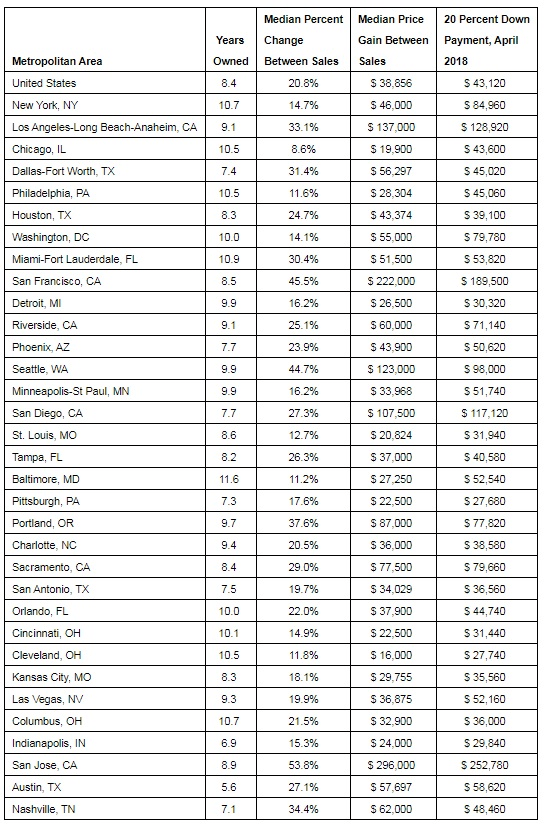
– Home sellers in San Jose sold their homes for 54 percent more than they paid, for a median gain of $296,000
– Nationally, home sellers in 2017 made about $39,000 after owning their homes for eight and a half years. That’s a profit of about 21 percent.
– San Jose, where sellers are making the biggest profits, is seeing the fastest home value appreciation and the biggest declines in inventory.
– Most sellers are also trying to buy another home at the same time they are selling.
Seattle, WA – June 26, 2018 (PRNewswire) Through 2017, the West Coast saw some of the biggest home value increases over the past decade, and home sellers are seeing big profits as a result.
Nationally, home sellers last year made nearly $39,000, or 21 percent, when compared with what they originally paid for the home, according to a Zillow® analysis(i). The typical seller had lived in their home for 8.4 years before selling it.
In San Jose, Calif., the typical home sold in 2017 earned the sellers 54 percent more than they originally paid for it nine years earlier, the highest profits of the metros analyzed. In the San Jose and San Francisco metros, sellers made more than the median value of a typical U.S. home.
A short supply of homes for sale has kept upward pressure on home prices, especially in markets where available homes are hardest to find. The profits are welcome news for home sellers who are able to cash in on higher home prices, but demonstrate how difficult the market is for buyers. It is increasingly common for homes to sell for more than the listed price – in 2017, nearly a quarter of all homes sold for more than the asking price, up from 18 percent in 2012(ii).
“In a housing market that’s been plagued by low inventory and increasing demand, homeowners in the nation’s hottest markets have been able to cash in when they sell their homes,” said Zillow Senior Economist Aaron Terrazas. “A home is typically the biggest investment someone makes, and it’s paid off for longtime owners in many markets across the country. Today’s typical seller bought in 2010 – just before the national housing market bottomed out in 2012. Of course, these sellers typically are buyers as well, but the profits from the sale of their former home give them an advantage over first-time buyers who may be coming in with smaller down payments.”
Nashville sellers sold their homes for a median of 34 percent more than they paid for it, the fifth highest percent gain among the markets Zillow analyzed. They made these profits faster than markets where home sellers saw larger returns – sellers in markets that saw bigger gains than Nashville sellers had owned their homes for at least a year longer before selling.
Most sellers – 71 percent – are simultaneously trying to buy their next home(iii). In 25 of the markets analyzed, the profits sellers made are not enough for a 20 percent down payment on the median home in that same area. Sellers only made enough to cover a down payment in places where they saw the biggest percent gains on the sale.
Zillow
Zillow is the leading real estate and rental marketplace dedicated to empowering consumers with data, inspiration and knowledge around the place they call home, and connecting them with great real estate professionals. In addition, Zillow operates an industry-leading economics and analytics bureau led by Zillow Group’s Chief Economist Dr. Svenja Gudell. Dr. Gudell and her team of economists and data analysts produce extensive housing data and research covering more than 450 markets at Zillow Real Estate Research. Zillow also sponsors the quarterly Zillow Home Price Expectations Survey, which asks more than 100 leading economists, real estate experts and investment and market strategists to predict the path of the Zillow Home Value Index over the next five years. Launched in 2006, Zillow is owned and operated by Zillow Group, Inc. (NASDAQ: Z and ZG), and headquartered in Seattle.
Zillow is a registered trademark of Zillow, Inc.
(i) This analysis only looked at homes that were sold by individual sellers in 2017, and didn’t sell twice within a 60 day period. Only markets with at least 100 transactions were included.
Washington, D.C. – May 2, 2018 (nar.realtor) Government-sponsored enterprises Fannie Mae and Freddie Mac both reported multi-billion dollar profits this week. NAR President Elizabeth Mendenhall, a sixth-generation Realtor® from Columbia, Missouri and CEO of RE/MAX Boone Realty issued the following statement calling on the Federal Housing Finance Agency to reduce the fees the GSEs charge to lenders and homebuyers:
“The National Association of Realtors® urges government-sponsored enterprises Fannie Mae and Freddie Mac to reduce the credit risk guarantee fees, or g-fees, charged to lenders and the upfront loan leveling pricing adjustments, or LLPAs, charged to consumers.
“FHFA’s current fee policies are resulting in billions of dollars of profits for the enterprises. Realtors® believe that fees should reflect the enterprises’ newly lower corporate tax rate, preserve the current target rate of return and be used only to protect taxpayers against enterprise-related losses. High fees should not be used to pay Wall Street-like returns to the U.S. Treasury and fund general government spending.
“We continue to urge (link is external) FHFA to act quickly and reduce g-fees and LLPAs, as continued high fees only reduce access to mortgage credit and raise the costs of homeownership at a time when home prices and mortgage rates are also rising.”
The National Association of Realtors® is America’s largest trade association, representing 1.3 million members involved in all aspects of the residential and commercial real estate industries.
But Homeowners Staying Put Longer as Average Homeownership Tenure Rises to New High; Kansas City, San Jose, Nashville Led Major Metros in Home Price Appreciation in 2017; All-Cash Purchase Share Increases Following Four Years of Declines
Irvine, CA – Feb. 1, 2018 (PRNewswire) ATTOM Data Solutions, curator of the nation’s largest multi-sourced property database, today released its Year-End and Q4 2017 U.S. Home Sales Report, which shows that home sellers in Q4 2017 realized an average home price gain since purchase of $54,000, up from $53,732 in the previous quarter and up from $47,133 in Q4 2016 to the highest since Q3 2007 — a more than 10-year high.
That $54,000 average home seller profit represented an average 29.7 percent return on investment compared to the original purchase price, up from 28.8 percent in the previous quarter and up from 26.8 percent in Q4 2016 to the highest average home seller ROI since Q3 2007.
“It’s the most profitable time to sell a home in more than 10 years yet homeowners are staying put longer than we’ve ever seen,” said Daren Blomquist, senior vice president at ATTOM Data Solutions. “While home sellers on the West Coast are realizing the biggest profits, rapid home price appreciation in red state markets is rivaling that of the high-flying coastal markets and producing sizable profits for home sellers in those middle-American markets as well.”
Among 155 metropolitan statistical areas with sufficient historical data, those with the highest average home seller ROI were San Jose, California (90.9 percent ROI); San Francisco, California (73.3 percent); Merced, California (64.6 percent); Seattle, Washington (64.4 percent); and Santa Cruz, California (59.8 percent).
“The biggest story for the greater Seattle housing market in 2017 was persistently low inventory levels which continued to push home prices higher,” said Matthew Gardner, chief economist at Windermere Real Estate, covering the Seattle market. “Sales in King County dropped modestly, but that can be blamed on rising prices which are forcing many buyers to look in neighboring counties to the north and south of Seattle where homes are significantly less expensive. I expect more of the same in 2018; an ongoing shortage of inventory combined with an economy that continues to add jobs means the Seattle market will remain very competitive and increasingly expensive.”
Kansas City, San Jose, Nashville lead major metros in home price appreciation
The U.S. median home price in 2017 was $235,000, up 8.3 percent from 2016 to a new all-time high. Annual home price appreciation in 2017 slowed slightly compared to the 8.5 percent in 2016.
Among 112 metropolitan statistical areas with a population of 200,000 or more and sufficient home price data, those with the biggest year-over-year increase in home prices were Ocala, Florida (up 14.3 percent); Kansas City, Missouri (up 13.4 percent); San Jose, California (up 13.3 percent); Salem, Oregon (up 12.9 percent); and Nashville, Tennessee (up 12.5 percent).
Along with Kansas City, San Jose and Nashville, other major metro areas with a population of at least 1 million with a double-digit percentage increase in home prices in 2017 were Las Vegas (up 12.3 percent); Salt Lake City (up 10.9 percent); Seattle (up 10.8 percent); Orlando (up 10.7 percent); Tampa-St. Petersburg (up 10.7 percent); Portland (up 10.5 percent); and Jacksonville, Florida (up 10.1 percent).
64 of the 112 metros (57 percent) reached new record home price peaks in 2017, including Los Angeles, Dallas, Houston, Atlanta, and San Francisco.
“Southern California closed out 2017 with sales volume increases, providing sellers with a continued positive rate of return growth on their homeowner equity, and we are forecasting a further bullish market in 2018,” said Michael Mahon, president of First Team Real Estate, covering the Southern California market. “Low available listing inventories, greater consumer cash flows from tax plan changes, continued gains in the stock market and continued declines in unemployment, are all contributing factors to high consumer confidence, which we believe will further elevate property values in 2018.”
“Although Ohio continues to work through a long tail of lingering distress, strong buyer demand for both distressed and non-distressed properties pushed home prices to new all-time highs in the majority of markets across the state,” said Matthew Watercutter, senior regional vice president and broker of record for HER Realtors, covering the Dayton, Columbus and Cincinnati markets in Ohio. “That strong buyer demand is evident in the increasing share of all-cash purchases statewide — more than one in three buyers in Ohio purchased with cash in 2017.”
Homeownership tenure at new record high nationwide, down in Denver, Dallas, Santa Cruz
Homeowners who sold in the fourth quarter of 2017 had owned their homes an average of 8.18 years, up from 8.12 years in the previous quarter and up from 7.78 years in Q4 2016 to the longest average home seller tenure as far back as data is available, Q1 2000.
Counter to the national trend, 10 of the 108 metro areas analyzed in the report posted a year-over-year decrease in average home seller tenure: Norwich-New London, Connecticut (down 5 percent); Denver, Colorado (down 3 percent); Bremerton-Silverdale, Washington (down 2 percent); Eugene, Oregon (down 2 percent); Colorado Springs, Colorado (down 2 percent); Provo-Orem, Utah (down 2 percent); Dallas-Fort Worth, Texas (down 1 percent); Manchester-Nashua, New Hampshire (down 1 percent); Chattanooga, Tennessee (down less than 1 percent); and Santa Cruz, California (down less than 1 percent).
Cash sales share increases in 2017 following four years of declines
Nationwide all-cash purchases accounted for 29.0 percent of single family home and condo sales in 2017, up slightly from 28.7 percent in 2016 and still well above the pre-recession average of 20.3 percent between 2000 and 2007. The increase in cash sales share in 2017 followed four consecutive years of annual decreases.
Among 156 metropolitan statistical areas with a population of at least 200,000 and sufficient cash sales data, those with the highest share of all-cash purchases in 2017 were Mobile, Alabama (69.8 percent); Binghamton, New York (60.9 percent); Macon, Georgia (57.7 percent); and Columbus, Georgia (56.2 percent).
U.S. distressed sales share drops to 10-year low, up in 12 states and DC
Distressed home sales — including bank-owned (REO) sales, third-party foreclosure auction sales, and short sales — accounted for 14.0 percent of all U.S. single family home and condo sales in 2017, down from 15.5 percent in 2016 and down from a peak of 38.6 percent in 2011.
Counter to the national trend, the share of distressed sales increased in 2017 in the District of Columbia (up 31 percent) and 12 states, including Delaware (up 21 percent); New Jersey (up 9 percent); Ohio (up 6 percent); Louisiana (up 19 percent); and New York (up 10 percent).
Among 203 metropolitan statistical areas with a population of at least 200,000 those with the highest share of distressed sales in 2017 were Atlantic City, New Jersey (39.4 percent); Mobile, Alabama (32.0 percent); Montgomery, Alabama (29.9 percent); Fayetteville, North Carolina (27.3 percent); and Akron, Ohio (25.3 percent).
Among 52 metropolitan statistical areas with a population of at least 1 million, those with the highest share of distressed sales in 2017 were Philadelphia, Pennsylvania (23.8 percent); Baltimore, Maryland (23.1 percent); Cleveland, Ohio (22.8 percent); Memphis, Tennessee (20.4 percent); and Columbus, Ohio (20.2 percent).
Highest share of institutional investor purchases in Memphis
Institutional investors nationwide accounted for 2.6 percent of all single family home and condo sales in 2017, down from 3.0 percent in 2016.
Among 182 metropolitan statistical areas with a population of at least 200,000 and sufficient institutional investor sales data, those with the highest share of institutional investor sales in 2017 were Memphis, Tennessee (10.0 percent); Columbus, Georgia (8.6 percent); Birmingham, Alabama (8.3 percent); Killeen, Texas (7.3 percent); and Macon, Georgia (7.3 percent).
FHA buyer share at lowest level since 2014
Nationwide buyers using Federal Housing Administration (FHA) loans accounted for 13.6 percent of all single family home and condo purchases in 2017, down from 15.4 percent in 2016 to the lowest level since 2014 but still well above the pre-recession average of 7.0 percent between 2000 and 2007.
Among 182 metropolitan statistical areas with a population of at least 200,000 and sufficient FHA buyer data, those with the highest share of FHA buyers in 2017 were El Paso, Texas (29.4 percent); Beaumont-Port Arthur, Texas (27.9 percent); Merced, California (27.2 percent); Elkhart-Goshen, Indiana (26.3 percent); and Salt Lake City, Utah (24.4 percent).
Report methodology
The ATTOM Data Solutions U.S. Home Sales Report provides percentages of distressed sales and all sales that are sold to investors, institutional investors and cash buyers, a state and metropolitan statistical area. Data is also available at the county and zip code level upon request. The data is derived from recorded sales deeds, foreclosure filings and loan data. Statistics for previous quarters are revised when each new report is issued as more deed data becomes available for those previous months. Median sales price is calculated based on the sales price on the publicly recorded sales deed when available. If no sales price is recorded then the purchase loan amount is used to calculate median price, and if no purchase loan amount is available, the property’s Automated Valuation Model (AVM) at time of sale is used to calculate the median price.
Definitions
All-cash purchases: sales where no loan is recorded at the time of sale and where ATTOM has coverage of loan data.
Institutional investor purchases: residential property sales to non-lending entities that purchased at least 10 properties in a calendar year.
REO sale: a sale of a property that occurs while the property is actively bank owned (REO).
Third-party foreclosure auction sale: a sale of a property that occurs at the public foreclosure auction (trustee’s sale or sheriff’s sale) in which the property is sold to a third-party buyer and does not transfer back to the foreclosing bank.
Short sale: a sale of a property where the sale price is less than (short) the combined amount of loans secured by the property.
Data Licensing and Custom Report Order
Investors, businesses and government institutions can contact ATTOM Data Solutions to purchase the full dataset behind the Year-End U.S. Foreclosure Market Report, including data at the state, metro, county and zip code level. The data is also available via bulk license or in customized reports. For more information contact our Data Solutions Department at 800.462.5193 or datasales@attomdata.com.
About ATTOM Data Solutions ATTOM Data Solutions is the curator of the ATTOM Data Warehouse, a multi-sourced national property database that blends property tax, deed, mortgage, foreclosure, environmental risk, natural hazard, health hazards, neighborhood characteristics and other property characteristic data for more than 150 million U.S. residential and commercial properties. The ATTOM Data Warehouse delivers actionable data to businesses, consumers, government agencies, universities, policymakers and the media in multiple ways, including bulk file licenses, APIs and customized reports.
ATTOM Data Solutions also powers consumer websites designed to promote real estate transparency: RealtyTrac.com is a property search and research portal for foreclosures and other off-market properties; Homefacts.com is a neighborhood research portal providing hyperlocal risks and amenities information; HomeDisclosure.com produces detailed property pre-diligence reports.
ATTOM Data and its associated brands are cited by thousands of media outlets each month, including frequent mentions on CBS Evening News, The Today Show, CNBC, CNN, FOX News, PBS NewsHour and in The New York Times, Wall Street Journal, Washington Post, and USA TODAY.