California Home Sales Remain Solid in October as Prices Level Off and Low Rates Continue to Provide Support to the Housing Market

– Existing, single-family home sales totaled 434,170 in October on a seasonally adjusted annualized rate, down 0.9 percent from September and down 10.4 percent from October 2020.

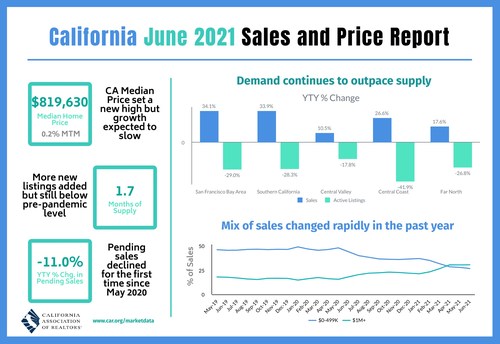
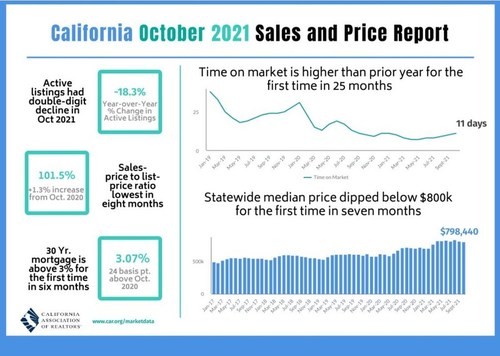
– October’s statewide median home price was $798,440, down 1.3 percent from September and up 12.3 percent from October 2020.

– Year-to-date statewide home sales were up 13.4 percent in October.

Los Angeles, CA – Nov. 16, 2021 (PRNewswire) California’s housing market continued to maintain a healthy sales pace above pre-pandemic levels even as sales have dipped from 2020, the CALIFORNIA ASSOCIATION OF REALTORS® (C.A.R.) said today.

Closed escrow sales of existing, single-family detached homes in California totaled a seasonally adjusted annualized rate of 434,170 in October, according to information collected by C.A.R. from more than 90 local REALTOR® associations and MLSs statewide. The statewide annualized sales figure represents what would be the total number of homes sold during 2021 if sales maintained the October pace throughout the year. It is adjusted to account for seasonal factors that typically influence home sales.

October’s sales pace dipped 0.9 percent on a monthly basis from 438,190 in September and was down 10.4 percent from a year ago, when 484,510 homes were sold on an annualized basis. Despite the fourth straight year-over-year sales decrease, statewide home sales maintained a 13.4 percent increase on a year-to-date basis.

California home sales remain solid in October as prices level off and low rates continue to provide support to the housing market.

“As the housing market moves from ‘frenzied’ to ‘less frenzied’ and price growth comes back to earth, fewer homes are selling above asking price and bidding wars are less prevalent, so more buyers who pushed pause earlier this year will be able to take advantage of still-cheap financing,” said 2022 C.A.R. President Otto Catrina, a Bay Area real estate broker and REALTOR®. “With their median price being 30 percent less than that of a single-family home, condominiums and townhomes have been selling particularly well as they are a more affordable option to buyers with a smaller budget.”

California home prices continued to level off as the market moved further into the off-season,  dipping below the $800,000 benchmark for the first time in seven months. At $798,440 in October, the statewide median price was down 1.3 percent from September’s $808,890 and was up 12.3 percent from the $711,300 recorded in October 2020. The month-to-month price decline was the second in a row, and the price drop from September was on par with the long run average of -1.5 percent recorded between a September and an October in the past 42 years.

“Despite a slowdown in sales from last year’s robust fall season, the California housing market continues to stabilize and is outperforming the pre-pandemic levels observed in 2017, 2018, and 2019,” C.A.R. Vice President and Chief Economist Jordan Levine said. “Slower sales activity suggests that the market is returning to its typical seasonal pattern and further market normalization can be expected in the upcoming months. While the market is showing signs of cooling off in recent months, 2021 continues to outpace last year’s sale level so far and is expected to post a gain at year-end.”

Other key points from C.A.R.’s October 2021 resale housing report include:

  • At the regional level, all five regions recorded a decline in sales on a year-over-year basis in October, with three regions dropping by double-digits. Wildfires continued to have a negative impact on market conditions in the Far North as sales in the region dropped 23.4 percent from a year ago. The decline will likely continue as the recovery process from wildfires could take months if not years. The Central Coast had the next biggest sales drop, with all counties within the region falling at least 13.8 percent from the prior year. Sales in Southern California also dipped by double-digits in October, with Orange, Riverside, and San Bernardino counties each dropping 10 percent or more. Central Valley (-9.1 percent) and San Francisco Bay Area (-7.3 percent) also posted sales declines from last year, but the declines were relatively small when compared to other regions.
  • More than four out of five counties — 43 of 51 — tracked by C.A.R. recorded a year-over-year decrease in closed sales in October, with 29 counties declining by more than 10 percent. Mariposa experienced the biggest sales decline from last year at -52.9 percent, followed by Plumas (-50.7 percent), and Tehama (-48.2 percent). Two of these counties were threatened by wildfires in late summer, which negatively affected housing demand. Counties recording a year-over-year sales dip had an average decrease of -19.4 percent in October. Seven counties experienced a year-over-year sales growth compared to 10 counties in September. Lassen had the largest sales gain (50.7 percent) from a year ago, followed by Yuba (28.9 percent), and Madera (20.2 percent).
  • Almost all California counties experienced year-over-year price growth, as 49 out of 51 counties tracked by C.A.R. showed a gain in their median prices from last year. Forty of them, in fact, increased more than 10 percent from last October. Madera had the largest price growth at 30.4 percent, followed by San Mateo (25.6 percent), Plumas (22.1 percent), and Sutter (22.1 percent). Santa Barbara and Mono were the only two counties that posted a drop, declining 19.3 percent and 0.5 percent, respectively from last October. Eight counties set new record high median prices in October, as compared to seven counties the prior month.
  • Market competitiveness remained elevated in October but was less heated than a few months ago. While the statewide median sales-price-to-list-price ratio remained above 100 percent in October, it was the lowest level in eight months. Nearly two-thirds of homes (60.2 percent) still sold above asking price in the latest monthly report, but it was at the lowest level since February 2021.
  • California’s Unsold Inventory Index (UII) dipped on a month-to-month basis for the first time in four months, as active listings fell 18.3 percent from last year. October’s UII was 1.8 months in October and 2.0 months in October 2020. The index indicates the number of months it would take to sell the supply of homes on the market at the current rate of sales.
  • The median number of days it took to sell a California single-family home inched up to 11 days in October, up from 10 days in September and 10 days in October 2020. The uptick was the first in more than two years.
  • C.A.R.’s statewide sales-price-to-list-price ratio* was 101.5 percent in October 2021 and 100.2 percent in October 2020.
  • The statewide average price per square foot** for an existing single-family home remained elevated. October’s price per square foot was $389, up from $326 in October a year ago.
  • The 30-year, fixed-mortgage interest rate averaged 3.07 percent in October, up from 2.83 percent in October 2020, according to Freddie Mac. The five-year, adjustable mortgage interest rate was an average of 2.54 percent, compared to 2.89 percent in October 2020.

Note:  The County MLS median price and sales data in the tables are generated from a survey of more than 90 associations of REALTORS® throughout the state and represent statistics of existing single-family detached homes only. County sales data are not adjusted to account for seasonal factors that can influence home sales. Movements in sales prices should not be interpreted as changes in the cost of a standard home. The median price is where half sold for more and half sold for less; medians are more typical than average prices, which are skewed by a relatively small share of transactions at either the lower end or the upper end. Median prices can be influenced by changes in cost, as well as changes in the characteristics and the size of homes sold. The change in median prices should not be construed as actual price changes in specific homes.

*Sales-to-list-price ratio is an indicator that reflects the negotiation power of home buyers and home sellers under current market conditions. The ratio is calculated by dividing the final sales price of a property by its last list price and is expressed as a percentage. A sales-to-list ratio with 100 percent or above suggests that the property sold for more than the list price, and a ratio below 100 percent indicates that the price sold below the asking price.

**Price per square foot is a measure commonly used by real estate agents and brokers to determine how much a square foot of space a buyer will pay for a property. It is calculated as the sale price of the home divided by the number of finished square feet. C.A.R. currently tracks price-per-square foot statistics for 50 counties.

Leading the way…® in California real estate for more than 110 years, the CALIFORNIA ASSOCIATION OF REALTORS® (www.car.org) is one of the largest state trade organizations in the United States with more than 200,000 members dedicated to the advancement of professionalism in real estate. C.A.R. is headquartered in Los Angeles. 

October 2021 County Sales and Price Activity
(Regional and condo sales data not seasonally adjusted)
October 2021Median Sold Price of Existing Single-Family HomesSales
State/Region/CountyOct.
2021
Sept.
2021
Oct.
2020
Price
MTM%
Chg
Price
YTY%
Chg
 Sales
MTM%
Chg
 Sales
YTY%
Chg
Calif. Single-family homes$798,440$808,890$711,300-1.3%12.3%-0.9%-10.4%
Calif. Condo/Townhomes$605,000$600,000$520,0000.8%16.3%-8.8%-7.0%
Los Angeles Metro Area$725,000$730,000$632,710-0.7%14.6%0.2%-12.7%
Central Coast$865,420$886,900$850,000-2.4%1.8%-5.7%-18.2%
Central Valley$450,000$450,000$395,0000.0%13.9%-0.7%-9.1%
Far North$370,000$370,000$344,0000.0%7.6%-8.4%-23.4%
Inland Empire$525,000$520,000$445,0001.0%18.0%-2.1%-15.2%
San Francisco Bay Area$1,275,000$1,290,000$1,100,000-1.2%15.9%1.2%-7.3%
Southern California$750,000$755,000$657,750-0.7%14.0%-0.8%-11.9%
San Francisco Bay Area
Alameda$1,280,000$1,300,000$1,049,000-1.5%22.0%-2.9%-0.3%
Contra Costa$900,500$897,000$787,2500.4%14.4%0.5%-11.7%
Marin$1,685,000$1,710,000$1,468,500-1.5%14.7%13.8%-31.3%
Napa$850,000$950,000$749,380-10.5%13.4%4.1%-24.6%
San Francisco$1,822,000$1,750,000$1,625,0004.1%12.1%27.5%6.4%
San Mateo$2,110,000$1,975,000$1,680,0006.8%25.6%-6.1%-19.6%
Santa Clara$1,625,000$1,630,000$1,442,500-0.3%12.7%1.3%-4.8%
Solano$580,000$570,000$508,0001.8%14.2%6.7%-3.2%
Sonoma$750,000$754,000$720,000-0.5%4.2%-4.0%2.2%
Southern California
Los Angeles$848,970$886,050$745,080r-4.2%13.9%6.6%-7.7%
Orange$1,120,000$1,100,000$930,0001.8%20.4%-7.4%-20.2%
Riverside$580,000$570,000$485,0001.8%19.6%-4.7%-18.4%
San Bernardino$445,000$437,000$365,0001.8%21.9%2.0%-10.0%
San Diego$850,000$850,000$749,0000.0%13.5%-4.9%-8.3%
Ventura$830,000$815,000$750,0001.8%10.7%-5.3%-8.0%
Central Coast
Monterey$865,250$826,250$850,0004.7%1.8%-0.9%-17.9%
San Luis Obispo$800,000$755,000$700,5006.0%14.2%-9.2%-23.8%
Santa Barbara$837,000$1,000,000$1,037,500-16.3%-19.3%0.7%-13.8%
Santa Cruz$1,136,000$1,190,000$1,060,000-4.5%7.2%-15.7%-14.8%
Central Valley
Fresno$385,000$380,000$331,5001.3%16.1%-2.8%-6.0%
Glenn$307,000$327,500$287,500-6.3%6.8%18.2%-18.8%
Kern$340,000$341,500$295,000-0.4%15.3%4.3%-5.8%
Kings$325,000$320,000$290,5001.6%11.9%-15.2%-29.1%
Madera$394,880$375,000$302,7505.3%30.4%25.3%20.2%
Merced$370,000$370,000$322,5000.0%14.7%1.5%-6.9%
Placer$649,000$650,000$548,000-0.2%18.4%-4.8%-24.7%
Sacramento$510,000$507,000$440,0000.6%15.9%0.8%-6.8%
San Benito$768,000$792,500$634,000-3.1%21.1%1.7%13.0%
San Joaquin$500,000$515,000$431,440-2.9%15.9%-4.5%-16.7%
Stanislaus$440,000$440,000$377,0000.0%16.7%-6.6%-4.9%
Tulare$325,000$320,000$283,0001.6%14.8%1.0%-3.9%
Far North
Butte$460,000$440,880$401,5004.3%14.6%-5.1%-15.1%
Lassen$232,500$205,000$194,50013.4%19.5%75.0%40.0%
Plumas$470,000$397,000$385,00018.4%22.1%-19.6%-50.7%
Shasta$359,500$365,000$344,900-1.5%4.2%-7.1%-15.9%
Siskiyou$329,500$315,000$286,0004.6%15.2%-21.6%-43.7%
Tehama$343,000$315,000$283,5008.9%21.0%-31.0%-48.2%
Other Calif. Counties
Amador$430,640$432,500$366,500-0.4%17.5%-34.2%-35.9%
Calaveras$432,000$468,500$393,640-7.8%9.7%-8.0%-32.2%
Del Norte$360,100$437,500$325,000-17.7%10.8%27.3%-20.0%
El Dorado$615,000$650,000$559,000-5.4%10.0%0.4%-40.8%
Humboldt$420,000$430,000$379,500-2.3%10.7%-3.8%-17.8%
Lake$345,000$372,120$325,000-7.3%6.2%17.1%-6.8%
Mariposa$455,000$459,000$375,000-0.9%21.3%-5.9%-52.9%
Mendocino$534,000$500,000$529,5006.8%0.8%5.8%-14.1%
Mono$840,000$844,500$844,500-0.5%-0.5%-23.8%-33.3%
Nevada$525,000$549,500$492,500-4.5%6.6%-2.3%-21.9%
Sutter$422,550$410,000$346,0503.1%22.1%10.5%20.0%
Tuolumne$385,000$382,500$349,5000.7%10.2%-16.1%-22.7%
Yolo$582,500$612,500$517,250-4.9%12.6%-2.8%0.0%
Yuba$413,000$409,900$350,0000.8%18.0%-8.4%28.9%
r = revised
October 2021 County Unsold Inventory and Days on Market
(Regional and condo sales data not seasonally adjusted)
October 2021Unsold Inventory IndexMedian Time on Market
State/Region/CountyOct.
2021
Sept.
2021
Oct.
2020
Oct.
2021
Sept.
2021
Oct.
2020
Calif. Single-family home1.81.92.011.010.010.0
Calif. Condo/Townhome1.61.72.411.010.014.0
Los Angeles Metro Area1.91.92.111.010.010.0
Central Coast1.81.92.110.010.013.0
Central Valley1.81.91.89.08.07.0
Far North3.22.92.620.018.019.0
Inland Empire2.02.12.012.011.011.0
San Francisco Bay Area1.41.61.812.011.011.0
Southern California1.81.92.011.010.09.0
San Francisco Bay Area
Alameda1.31.41.611.010.010.0
Contra Costa1.41.51.610.09.08.0
Marin1.31.92.021.012.524.0
Napa2.83.43.134.037.038.0
San Francisco1.62.32.213.013.014.0
San Mateo1.51.51.89.09.010.0
Santa Clara1.11.41.68.09.08.0
Solano1.41.61.928.027.028.0
Sonoma1.82.12.734.034.037.0
Southern California
Los Angeles2.02.02.110.010.09.0
Orange1.51.52.09.08.010.0
Riverside2.02.02.113.011.011.0
San Bernardino2.12.32.012.011.012.0
San Diego1.51.61.89.09.07.0
Ventura1.81.92.024.024.030.0
Central Coast
Monterey2.22.22.311.510.013.0
San Luis Obispo1.71.82.28.09.013.0
Santa Barbara1.41.72.010.09.014.0
Santa Cruz1.81.82.112.011.010.0
Central Valley
Fresno1.91.91.87.07.07.0
Glenn3.73.73.813.022.04.0
Kern1.82.12.210.08.08.0
Kings2.32.01.87.06.06.0
Madera2.12.92.712.014.013.0
Merced1.72.01.610.07.010.0
Placer1.71.81.58.08.07.0
Sacramento1.41.71.59.08.06.0
San Benito2.12.22.58.011.09.0
San Joaquin1.71.81.511.010.07.0
Stanislaus1.91.81.79.09.07.0
Tulare2.12.12.27.06.010.0
Far North
Butte2.42.42.410.09.011.0
Lassen4.27.35.098.0109.096.5
Plumas4.54.12.675.087.0127.0
Shasta2.72.62.614.013.09.0
Siskiyou5.43.82.318.520.016.0
Tehama5.03.22.841.046.034.0
Other Calif. Counties
Amador3.62.33.026.514.019.0
Calaveras2.82.72.154.056.053.0
Del Norte3.24.53.590.089.594.0
El Dorado2.72.72.017.013.025.0
Humboldt2.22.42.110.010.013.5
Lake4.55.23.726.017.031.0
Mariposa5.14.32.726.07.029.5
Mendocino4.34.34.041.045.551.5
Mono3.42.63.0107.082.085.0
Nevada2.93.12.711.012.012.0
Sutter1.82.12.010.511.09.0
Tuolumne3.12.52.515.012.023.0
Yolo1.21.62.19.08.08.0
Yuba1.91.81.710.57.010.5
r = revised

SOURCE CALIFORNIA ASSOCIATION OF REALTORS® (C.A.R.)

Despite a New Record Price, Growth Slowed and Pending Sales Dipped For First Time Since May 2020, C.A.R. Reports

– Existing, single-family home sales totaled 436,020 in June on a seasonally adjusted annualized rate, down 2.2 percent from May and up 28.3 percent from June 2020.

– June’s statewide median home price was $819,630, up 0.2 percent from May and up 30.9 percent from June 2020.

– Year-to-date statewide home sales were up 33.6 percent in June.

Los Angeles, CA – July 16, 2021 (PRNewswire) Despite an impressive performance in the first six months of the year, the market momentum appears to be moderating with existing home sales dipping for the second month in a row, the CALIFORNIA ASSOCIATION OF REALTORS® (C.A.R.) said today.

CAR Logo

Closed escrow sales of existing, single-family detached homes in California totaled a seasonally adjusted annualized rate of 436,020 in June, according to information collected by C.A.R. from more than 90 local REALTOR® associations and MLSs statewide. The statewide annualized sales figure represents what would be the total number of homes sold during 2021 if sales maintained the June pace throughout the year. It is adjusted to account for seasonal factors that typically influence home sales.

June home sales dipped 2.2 percent on a monthly basis from 445,660 in May but were up 28.3% percent from a year ago, when 339,910 homes were sold on an annualized basis. With strong sales growth in June, the state housing market ended the first half of the year with a year-to-date increase of 33.6 percent. Higher-priced markets continued to do well while sales of lower-priced properties remained below last year’s levels. 

C.A.R. June 2021 Sales and Price Report

“We’re starting to see what a difference just a slight uptick in inventory and listings can do to help lessen the buying frenzy and create a sense of normalcy,” said C.A.R. President Dave Walsh. “The market is still extremely competitive, with 70 percent of homes selling above list price; however, the number of new listings increased in June, and both the share of listings with a reduced price and median reduction amount increased, giving buyers more opportunities to purchase.”

California’s median home price set a new record high for the fourth straight month in June as the median price slightly increased 0.2 percent on a month-to-month basis to $819,630 in June, up from May’s $818,260 and up 30.9% from the $626,170 recorded last June. The median price in California also remained above the $800,000 benchmark for the third consecutive month.

The pace of growth in home prices appeared to be decelerating, however, as the change between May and June remained below one percent, and the increase was the smallest in the past four months.  On a month-to-month basis, the statewide median price increase in June 2021 was slightly below the average May-to-June growth rate of 1.0 percent observed between 1979 and 2020.   

“On a year-over-year basis, the statewide median price increased more than 30 percent for the third consecutive month. Tight supply, low rates and the change in the mix of sales continue to be the primary factors pushing up home prices to record levels,” said C.A.R. Vice President and Chief Economist Jordan Levine. “However, we are expecting price growth to slow from this point on as the top end of the market begins moderating. With pending sales down for the first time in 14 months, closed sales – which have been declined 5 out of the last 6 months – will likely remain lackluster as the market enters the second half of the year.”  

Other key points from C.A.R.’s June 2021 resale housing report include:

  • At the regional level, four of the five major regions in the state set new record high median prices in June, with each region increasing by more than 20 percent from a year ago. The San Francisco Bay Area continue to grow at the fastest pace with a year-over-year gain of 35.0 percent, followed by Southern California (30.3 percent), the Central Valley (23.8 percent), the Far North (22.0 percent) and the Central Coast (20.8 percent).
  • All 51 counties tracked by C.A.R. experienced price growth on a year-over-year basis, with 47 of them reported a double-digit rate increase in median price from last year. Del Norte had the largest price gain of 48.1 percent in June, followed by Siskiyou (40.5 percent) and Santa Barbara (39.2 percent). Twenty-five counties set new record high median prices in June. Lake had the smallest price growth of all counties with a 3.9 percent increase from June 2020. Glenn (5.1 percent), San Francisco (8.0 percent), and Lassen (8.9 percent) were the other three counties with only a single-digit price gain from a year ago.
  • Higher-priced markets continued to do well while sales of lower-priced properties remained below last year’s levels. The million-dollar market increased in demand by triple-digits year-over-year, with sales of homes priced $2m and above surging 141 percent from a year ago. Sales of homes priced below $300k, on the other hand, continued to fall precipitously, with the year-over-year growth rate declining 48 percent in June. Tight housing supply continues to be the primary constraining factor for sales in the lower price segment. The state has sold more homes in the million-dollar market than the sub $500k market in Q221, a condition that has not been observed in California in the past.
  • All major regions continued to grow by double-digit from a year ago as the market began to climb out of its pandemic trough reached in May 2020.  Of all regions, the San Francisco Bay Area had the biggest jump of 34.1 percent year-over-year, with seven of the nine counties increasing more than 29 percent from a year ago. Southern California had a sales surge of 33.9 percent from the same month in 2020, followed by the Central Coast (26.6 percent), the Far North (17.6 percent), and the Central Valley (10.5 percent). 
  • Nearly nine out of 10 counties – 44 of 51 – tracked by C.A.R. had a year-over-year increase in closed sales in June, with 39 counties surging by more than 10 percent in sales from last year.  Mono had the strongest growth in sales from a year ago at 100 percent, followed by San Francisco (87.1 percent), and Del Norte (80 percent).  Counties with an increase from last year had an averaged gain of 30.6 percent in June, compared to 89.2 percent in May.  Six counties had a sales decline from last year, with Glenn dropping the most (-57.1 percent), followed by Solano (-7.8 percent), Sutter (-6.9 percent), and Tulare (-6.9 percent). 
  • The state housing supply condition continued to improve with active listings reaching the highest level since last October.  The number of for sale properties increased 15.4 percent in June from the prior month as more homes were being listed on the market.  New active listings, while still down 12.3 percent from two years ago, increased both month-over-month and year-over-year by around 8 percent in June 2021.  Housing supply typically climbs during this time of the year and remains on an upward trend until late July/early August. 
  • Almost all counties reported by C.A.R. declined in active listings from last June, and 47 of them dropped by double-digit when compared to the same time last year.  Marin had the biggest decline in active listings, plunging 59.0 percent year-over-year, while Ventura also dropped more than half with a 51.1 percent slide from a year ago.  Sutter (17.8 percent), Lassen (8.9 percent), and Stanislaus (0.5 percent) were the only counties in the state with an increase in active listings from the prior year.    
  • The median number of days it took to sell a California single-family home decreased to 8 days in June, down from 19 days in June 2020.
  • C.A.R.’s statewide sales-price-to-list-price ratio* posted a record high in June at 104.1 percent and was 99.5 percent in June 2020.
  • The statewide average price per square foot** for an existing single-family home remained elevated. At $391, June’s price per square foot was an all-time high. The price per square foot was $293 in June a year ago.
  • The 30-year, fixed-mortgage interest rate averaged 2.98 percent in June, down from 3.16 percent in June 2020, according to Freddie Mac. The five-year, adjustable mortgage interest rate was an average of 2.56 percent, compared to 3.09 percent in June 2020.

Note:  The County MLS median price and sales data in the tables are generated from a survey of more than 90 associations of REALTORS® throughout the state and represent statistics of existing single-family detached homes only. County sales data are not adjusted to account for seasonal factors that can influence home sales. Movements in sales prices should not be interpreted as changes in the cost of a standard home. The median price is where half sold for more and half sold for less; medians are more typical than average prices, which are skewed by a relatively small share of transactions at either the lower end or the upper end. Median prices can be influenced by changes in cost, as well as changes in the characteristics and the size of homes sold. The change in median prices should not be construed as actual price changes in specific homes.

*Sales-to-list-price ratio is an indicator that reflects the negotiation power of home buyers and home sellers under current market conditions. The ratio is calculated by dividing the final sales price of a property by its last list price and is expressed as a percentage. A sales-to-list ratio with 100 percent or above suggests that the property sold for more than the list price, and a ratio below 100 percent indicates that the price sold below the asking price.

**Price per square foot is a measure commonly used by real estate agents and brokers to determine how much a square foot of space a buyer will pay for a property. It is calculated as the sale price of the home divided by the number of finished square feet. C.A.R. currently tracks price-per-square foot statistics for 50 counties.

Leading the way…® in California real estate for more than 110 years, the CALIFORNIA ASSOCIATION OF REALTORS® (www.car.org) is one of the largest state trade organizations in the United States with more than 200,000 members dedicated to the advancement of professionalism in real estate. C.A.R. is headquartered in Los Angeles.

June-21Median Sold Price of Existing Single-Family HomesSales
State/Region/CountyJun-21May-21Jun-20Price
MTM%
Chg
Price
YTY%
Chg
 Sales
MTM%
Chg
 Sales
YTY%
Chg
CA SFH (SAAR)$819,630$818,260$626,1700.2%30.9%-2.2%28.3%
CA Condo/Townhomes$600,000$592,000$486,2501.4%23.4%7.9%60.6%
Los Angeles Metropolitan Area$737,500$725,000$553,0001.7%33.4%10.4%35.1%
Central Coast$890,000$900,000$736,500-1.1%20.8%9.7%26.6%
Central Valley$452,000$445,000$365,0001.6%23.8%10.7%10.5%
Far North$380,000$365,000$311,5004.1%22.0%16.8%17.6%
Inland Empire$525,000$510,000$410,0002.9%28.0%10.9%17.0%
S.F. Bay Area$1,350,000$1,340,000$1,000,0000.7%35.0%10.9%34.1%
Southern California$766,000$752,250$588,0001.8%30.3%11.5%33.9%
S.F. Bay AreaJun-21May-21Jun-20Price
MTM%
Chg
Price
YTY%
Chg
 Sales
MTM%
Chg
 Sales
YTY%
Chg
Alameda$1,300,000$1,312,500$976,000-1.0%33.2%6.9%44.8%
Contra Costa$990,000$1,015,000$750,500-2.5%31.9%10.0%29.2%
Marin$1,712,500$1,632,500$1,490,0004.9%14.9%16.2%0.0%
Napa$955,500$837,500$725,00014.1%31.8%17.2%52.8%
San Francisco$1,950,000$1,900,000$1,805,0002.6%8.0%24.0%87.1%
San Mateo$2,275,000$2,075,000$1,735,0009.6%31.1%3.8%34.7%
Santa Clara$1,750,000$1,675,000$1,382,0004.5%26.6%9.6%47.0%
Solano$575,000$579,000$496,750-0.7%15.8%21.9%-7.8%
Sonoma$825,000$780,000$708,8005.8%16.4%13.6%33.7%
Southern CaliforniaJun-21May-21Jun-20Price
MTM%
Chg
Price
YTY%
Chg
 Sales
MTM%
Chg
 Sales
YTY%
Chg
Los Angeles$796,120$725,680$619,320r9.7%28.5%8.5%42.4%
Orange$1,138,000$1,100,000$870,0003.5%30.8%13.7%61.6%
Riverside$575,000$560,000$450,0002.7%27.8%7.2%17.0%
San Bernardino$435,000$410,000$325,0006.1%33.8%17.7%17.0%
San Diego$865,000$851,000$678,0001.6%27.6%16.0%29.2%
Ventura$840,000$806,000$700,0004.2%20.0%9.5%40.7%
Central CoastJun-21May-21Jun-20Price
MTM%
Chg
Price
YTY%
Chg
 Sales
MTM%
Chg
 Sales
YTY%
Chg
Monterey$862,500$887,000$740,000-2.8%16.6%14.9%48.0%
San Luis Obispo$799,000$775,000$645,5003.1%23.8%18.2%40.9%
Santa Barbara$935,000$1,299,000$671,750-28.0%39.2%-6.1%5.6%
Santa Cruz$1,175,000$1,300,000$905,000-9.6%29.8%12.9%14.7%
Central ValleyJun-21May-21Jun-20Price
MTM%
Chg
Price
YTY%
Chg
 Sales
MTM%
Chg
 Sales
YTY%
Chg
Fresno$375,000$361,500$313,9503.7%19.4%13.2%12.4%
Glenn$310,000$384,000$295,000-19.3%5.1%-18.2%-57.1%
Kern$325,000$317,000$275,0002.5%18.2%9.2%21.6%
Kings$295,000$315,000$265,000-6.3%11.3%8.0%13.7%
Madera$357,500$360,000$300,000-0.7%19.2%8.9%3.7%
Merced$360,000$350,000$300,0002.9%20.0%17.4%10.9%
Placer$670,500$663,450$515,0001.1%30.2%11.7%12.4%
Sacramento$525,000$500,000$417,0005.0%25.9%12.1%13.0%
San Benito$794,690$810,000$586,400-1.9%35.5%25.4%45.1%
San Joaquin$515,000$500,000$415,0003.0%24.1%7.0%14.6%
Stanislaus$430,000$440,000$355,000-2.3%21.1%11.4%-4.6%
Tulare$335,000$324,350$270,0003.3%24.1%2.5%-6.9%
Far NorthJun-21May-21Jun-20Price
MTM%
Chg
Price
YTY%
Chg
 Sales
MTM%
Chg
 Sales
YTY%
Chg
Butte$438,000$449,000$390,000-2.4%12.3%16.1%2.9%
Lassen$244,950$247,450$225,000-1.0%8.9%41.7%36.0%
Plumas$395,000$423,000$305,000-6.6%29.5%-5.6%13.3%
Shasta$365,000$360,000$295,0001.4%23.7%12.6%17.6%
Siskiyou$300,000$289,000$213,5003.8%40.5%69.8%73.8%
Tehama$318,500$348,000$240,000-8.5%32.7%10.6%15.6%
Other Counties in CaliforniaJun-21May-21Jun-20Price
MTM%
Chg
Price
YTY%
Chg
 Sales
MTM%
Chg
 Sales
YTY%
Chg
Amador$461,000$427,500$337,5007.8%36.6%-4.2%-2.8%
Calaveras$488,280$473,800$363,0003.1%34.5%26.9%37.5%
Del Norte$358,500$415,000$242,000-13.6%48.1%200.0%80.0%
El Dorado$702,000$688,000$510,0002.0%37.6%12.3%16.1%
Humboldt$420,000$400,000$317,0005.0%32.5%19.4%35.1%
Lake$335,000$360,000$322,500-6.9%3.9%24.4%23.0%
Mariposa$409,700$415,000$370,400-1.3%10.6%-18.2%12.5%
Mendocino$582,500$602,500$425,000-3.3%37.1%16.0%13.7%
Mono$822,500$1,140,000$720,000-27.9%14.2%20.0%100.0%
Nevada$566,000$563,250$433,7500.5%30.5%18.0%9.3%
Sutter$395,000$410,000$341,000-3.7%15.8%-17.3%-6.9%
Tuolumne$413,820$390,700$305,0005.9%35.7%22.1%47.7%
Yolo$616,000$617,500$475,000-0.2%29.7%14.5%4.2%
Yuba$430,100$400,000$328,9507.5%30.7%6.9%16.0%
Note: The MLS median price and sales data in the table below are generated from a survey of more than 90 associations of REALTORS® throughout the state, and represent statistics of existing single-family detached homes only.   sales data are not adjusted to account for seasonal factors that can influence home sales.  Movements in sales prices should not be interpreted as changes in the cost of a standard home.  Median prices can be influenced by changes in cost, as well as changes in the characteristics and the size of homes sold.  Due to the low sales volume in some areas, median price changes may exhibit unusual fluctuation.
Los Angeles Metropolitan Area is a 5- region that includes Los Angeles , Orange , Riverside , San Bernardino , and Ventura
S.F. Bay Area has been redefined to include the following counties: Alameda, Contra Costa, Marin, Napa, San Francisco, San Mateo, Santa Clara, Solano, and Sonoma
Inland Empire includes Riverside and San Bernardino
Note: “r” = revised
June-21Unsold Inventory IndexMedian Time on Market
State/Region/CountyJun-21May-21Jun-20Jun-21May-21Jun-20
CA SFH (SAAR)1.71.82.78.07.019.0
CA Condo/Townhomes1.61.73.48.08.021.0
Los Angeles Metropolitan Area1.71.93.18.08.023.0
Central Coast1.92.03.58.09.025.0
Central Valley1.61.62.27.06.014.0
Far North2.32.53.511.011.030.0
Inland Empire1.71.92.88.08.029.0
S.F. Bay Area1.41.52.39.08.018.0
Southern California1.71.82.97.07.020.0
S.F. Bay AreaJun-21May-21Jun-20Jun-21May-21Jun-20
Alameda1.31.31.98.08.013.0
Contra Costa1.21.21.97.07.014.0
Marin1.11.52.411.011.027.0
Napa2.22.85.733.529.052.0
San Francisco1.41.82.912.011.019.0
San Mateo1.41.52.47.08.010.0
Santa Clara1.31.52.18.07.011.0
Solano1.21.42.021.021.034.0
Sonoma1.92.03.431.029.040.0
Southern CaliforniaJun-21May-21Jun-20Jun-21May-21Jun-20
Los Angeles1.82.03.08.08.017.0
Orange1.51.63.57.07.020.0
Riverside1.71.72.78.08.027.0
San Bernardino1.92.22.88.08.033.0
San Diego1.51.62.26.07.012.0
Ventura1.81.94.621.022.042.0
Central CoastJun-21May-21Jun-20Jun-21May-21Jun-20
Monterey2.12.44.69.09.525.0
San Luis Obispo1.82.13.86.06.027.5
Santa Barbara2.01.63.29.09.027.0
Santa Cruz1.72.02.59.010.019.0
Central ValleyJun-21May-21Jun-20Jun-21May-21Jun-20
Fresno1.71.72.16.06.015.0
Glenn5.03.62.94.08.025.0
Kern1.61.72.37.06.014.0
Kings1.51.62.15.05.08.0
Madera2.02.23.18.08.529.0
Merced1.61.72.77.07.012.0
Placer1.41.42.26.06.014.0
Sacramento1.41.41.96.06.010.0
San Benito1.82.03.48.09.051.0
San Joaquin1.71.62.47.07.016.0
Stanislaus1.71.71.77.06.014.0
Tulare1.71.72.17.07.023.0
Far NorthJun-21May-21Jun-20Jun-21May-21Jun-20
Butte1.92.12.16.07.014.0
Lassen3.95.95.872.067.0106.0
Plumas4.03.68.163.061.099.0
Shasta2.02.23.09.08.023.0
Siskiyou2.53.55.87.57.539.0
Tehama2.42.64.028.532.071.0
Other Counties in CaliforniaJun-21May-21Jun-20Jun-21May-21Jun-20
Amador2.42.24.011.08.545.0
Calaveras2.12.44.449.048.579.0
Del Norte3.39.99.792.567.0132.0
El Dorado1.81.73.29.07.031.0
Humboldt2.12.33.88.57.09.5
Lake3.03.84.612.09.048.0
Mariposa3.83.05.67.510.066.0
Mendocino3.43.95.836.038.555.0
Mono3.93.711.657.561.082.0
Nevada2.12.33.49.08.021.5
Sutter2.41.71.78.07.021.5
Tuolumne2.63.04.810.09.031.5
Yolo1.21.52.17.07.019.0
Yuba1.71.61.96.06.016.0
Note: The  MLS median price and sales data in the table below are generated from a survey of more than 90 associations of REALTORS® throughout the state, and represent statistics of existing single-family detached homes only.   sales data are not adjusted to account for seasonal factors that can influence home sales.  Movements in sales prices should not be interpreted as changes in the cost of a standard home.  Median prices can be influenced by changes in cost, as well as changes in the characteristics and the size of homes sold.  Due to the low sales volume in some areas, median price changes may exhibit unusual fluctuation.
Los Angeles Metropolitan Area is a 5- region that includes Los Angeles , Orange , Riverside , San Bernardino , and Ventura
S.F. Bay Area has been redefined to include the following counties: Alameda, Contra Costa, Marin, Napa, San Francisco, San Mateo, Santa Clara, Solano, and Sonoma
Inland Empire includes Riverside  and San Bernardino

SOURCE CALIFORNIA ASSOCIATION OF REALTORS® (C.A.R.)

California Home Sales Ease In May As Statewide Median Price Inches Up To Set Another Record, C.A.R. Reports

– Existing, single-family home sales totaled 445,660 in May on a seasonally adjusted annualized rate, down 2.7 percent from April and up 86.7 percent from May 2020.

– May’s statewide median home price was $818,260, up 0.5 percent from April and up 39.1 percent from May 2020.

– Year-to-date statewide home sales were up 34.6 percent in May.

Los Angeles, CA – June 16, 2021 (PRNewswire) After months of breakneck market competition, California home sales moderated in May as buyer fatigue set in, while the median home price set another record high, the CALIFORNIA ASSOCIATION OF REALTORS® (C.A.R.) said today. 

CAR Logo

Closed escrow sales of existing, single-family detached homes in California totaled a seasonally adjusted annualized rate of 445,660 in May, according to information collected by C.A.R. from more than 90 local REALTOR® associations and MLSs statewide. The statewide annualized sales figure represents what would be the total number of homes sold during 2021 if sales maintained the May pace throughout the year. It is adjusted to account for seasonal factors that typically influence home sales.

May home sales dipped 2.7 percent on a monthly basis from 458,170 in April and up 86.7 percent from a year ago, when 238,740 homes were sold on an annualized basis. The sharp yearly sales jump was expected as the housing market was hit hard by the pandemic shutdown last year, when home sales dropped to the lowest level since the Great Recession.

California home sales ease in May as statewide median price inches up to set another record.

“The overheated housing market is showing signs of a much-needed cooling and could be a sign of waning buyer interest as the torrid pace of home price increases and buyer fatigue adversely affected demand,” said C.A.R. President Dave Walsh. “We’re seeing many would-be buyers taking a break and hoping to see more listings as the economy reopens and prospective sellers list their homes for sale.”

California’s median home price set another new record high in May as the statewide median price inched up 0.5 percent on a month-to-month basis to $818,260 in May, up from April’s revised $814,010 and up 39.1 percent from the $588,070 recorded last May. The year-over-year price gain was the highest ever recorded, and it was the second straight month that the state recorded an annual increase of over 30 percent. 

Robust demand of higher-priced properties contributed to the record-setting statewide median price. With million-dollar home sales surging more than 200 percent from May 2020, its market share is nearly double what it was a year ago when it was at 15.6 percent. More million-dollar properties were sold in the past couple of months than homes priced below $500,000.          

“A lack of housing inventory continues to push up prices, and modestly higher interest rates, increased competition, and declining affordability have caused some buyers to become discouraged. Despite strong growth rates, the level of home sales has fallen on a monthly basis in four of the last five months,” said C.A.R. Vice President and Chief Economist Jordan Levine. “Additionally, pending sales data for May, which was virtually unchanged from April, suggests further slowing in coming months. Fortunately, new listings have finally started to rise, which could help to sustain a higher level of home sales deeper into summer by providing much-needed supply.”    

Other key points from C.A.R.’s May 2021 resale housing report include:

  • At the regional level, all major regions had at least 44 percent year-over-year growth in sales from last May when the market hit its lowest point in 2020. Among all regions, the Central Coast had the biggest jump of 111.8 percent from a year ago, with sales in all four counties in the region surging by more than 99 percent. The San Francisco Bay Area also increased in sales by triple-digits (104.6 percent) from last year, followed by Southern California (80 percent), the Far North (58.6 percent), and the Central Valley (44 percent).
  • Nearly all counties — 49 of 51 — tracked by C.A.R. recorded a year-over-year sales increase in May, with 17 counties more than doubling the sales level reached a year ago. Six of the counties with more than 100 percent growth rate had a median price above $1 million in May 2021. Mono had the strongest sales growth from last year at 400 percent, followed by Plumas (260 percent), and San Benito (195 percent). Counties with an increase from last year had an averaged gain of 89.2 percent in May, compared to 70.7 percent in April. Del Norte (-59.1 percent) and Glenn (-4.3 percent) were the only counties with a sales decline from last year.
  • Sales growth remained concentrated in higher-priced markets, while home sales in the lower-end continued to be lackluster. Demand in the million-dollar segment increased by more than 200 percent year-over-year, with sales of homes priced $2 million and higher surging over 300 percent from a year ago. Sales of properties priced below $300k, on the other hand, continued to fall precipitously, with the year-over-year sales dropping 34 percent in May. Tight housing supply continues to be the primary factor constraining sales in the lower price segment.
  • Three out of five major regions reached new record high median prices in May, with each region growing more than 20 percent from a year ago. The San Francisco Bay Area had the highest year-over-year gain of 38.9 percent, followed by Southern California (33.1 percent), the Central Coast (32.6 percent), the Central Valley (27.1 percent), and the Far North (22.1 percent).
  • All 51 counties tracked by C.A.R. notched a gain in their median price on a year-over-year basis, with 50 of them reporting at least a double-digit growth rate from last May. Mono had the largest price growth of 119.2 percent in May, followed by Santa Barbara (103.8 percent) and Plumas (57.2 percent). Thirty-two counties set new record high median prices in May. Marin had the smallest price growth of all counties with an 8.8 percent increase from May 2020. It was also the only county with a single-digit price gain from a year ago.
  • The Unsold Inventory Index (UII) improved slightly from 1.6 months in April to 1.8 months in May but remained sharply below last year’s level. The month-over-month rise in inventory is partly due a slight increase in housing supply, but a slowdown in housing demand in May also contributed to a bump in the index. The index indicates the number of months it would take to sell the supply of homes on the market at the current rate of sales.
  • Active listings reached the highest level in six months after a 6.6 percent monthly increase in May and continued to inch up, following the seasonal pattern. Housing supply typically climbs during this time of the year and usually remains on an upward trend until late July/early August. The pace of growth on a month-to-month basis is on par with the average growth rate of 6.7 percent from April to May recorded between 2015 to 2019.
  • All counties reported by C.A.R. saw a decline in active listings from last May, and nearly all counties — 49 out of 51 — dipped more than 20 percent from year-ago levels. Ventura had the largest decline in housing supply, dropping 63.5 percent year-over-year, while Amador followed closely with a 62.5 percent slide from a year ago. Lassen (-1.8 percent) and San Francisco were the only two counties in the state with a single-digit decline in active listings from the prior year.
  • The median number of days it took to sell a California single-family home remained unchanged at the record low of 7 days in May, down from 17 days in May 2020.
  • C.A.R.’s statewide sales-price-to-list-price ratio* posted a record high in May at 103.8 percent and was 99.7 percent in May 2020.
  • The statewide average price per square foot** for an existing single-family home remained elevated. At $387, May’s price per square foot was an all-time high. The price per square foot was $281 in May a year ago.
  • The 30-year, fixed-mortgage interest rate averaged 2.96 percent in May, down from 3.23 percent in May 2020, according to Freddie Mac. The five-year, adjustable mortgage interest rate was an average of 2.62 percent, compared to 3.16 percent in May 2020.

Note:  The County MLS median price and sales data in the tables are generated from a survey of more than 90 associations of REALTORS® throughout the state and represent statistics of existing single-family detached homes only. County sales data are not adjusted to account for seasonal factors that can influence home sales. Movements in sales prices should not be interpreted as changes in the cost of a standard home. The median price is where half sold for more and half sold for less; medians are more typical than average prices, which are skewed by a relatively small share of transactions at either the lower end or the upper end. Median prices can be influenced by changes in cost, as well as changes in the characteristics and the size of homes sold. The change in median prices should not be construed as actual price changes in specific homes.

*Sales-to-list-price ratio is an indicator that reflects the negotiation power of home buyers and home sellers under current market conditions. The ratio is calculated by dividing the final sales price of a property by its last list price and is expressed as a percentage. A sales-to-list ratio with 100 percent or above suggests that the property sold for more than the list price, and a ratio below 100 percent indicates that the price sold below the asking price.

**Price per square foot is a measure commonly used by real estate agents and brokers to determine how much a square foot of space a buyer will pay for a property. It is calculated as the sale price of the home divided by the number of finished square feet. C.A.R. currently tracks price-per-square foot statistics for 50 counties.

Leading the way…® in California real estate for more than 110 years, the CALIFORNIA ASSOCIATION OF REALTORS® (www.car.org) is one of the largest state trade organizations in the United States with more than 200,000 members dedicated to the advancement of professionalism in real estate. C.A.R. is headquartered in Los Angeles.

May 2021 County Sales and Price Activity
(Regional and condo sales data not seasonally adjusted)

May 2021Median Sold Price of Existing Single-Family HomesSales
State/Region/CountyMay2021April2021May2020Price
MTM%
Chg
Price
YTY%
Chg
 Sales
MTM%
Chg
 Sales
YTY%
Chg
Calif. Single-family home$818,260$814,010r$588,0700.5%39.1%-2.7%86.7%
Calif. Condo/Townhome$592,000$570,000$464,9003.9%27.3%-8.8%150.9%
Los Angeles Metro Area$725,000$725,000$535,0000.0%35.5%-5.2%81.0%
Central Coast$900,000$925,620$678,500-2.8%32.6%-4.7%111.8%
Central Valley$445,000$435,000$350,0002.3%27.1%-0.4%44.0%
Far North$365,000$367,250$299,000-0.6%22.1%2.1%58.6%
Inland Empire$510,000$500,000$395,7402.0%28.9%-4.3%58.4%
San Francisco Bay Area$1,340,000$1,328,440$965,0000.9%38.9%-5.2%104.6%
Southern California$752,250$750,000$565,0000.3%33.1%-4.8%80.0%
San Francisco Bay Area
Alameda$1,312,500$1,300,000$955,0001.0%37.4%-1.6%130.2%
Contra Costa$1,015,000$990,000$690,0002.5%47.1%-6.6%95.1%
Marin$1,632,500$1,610,000$1,500,0001.4%8.8%-1.5%61.0%
Napa$837,500$950,000$672,500-11.8%24.5%-5.7%118.9%
San Francisco$1,900,000$1,800,000$1,627,5005.6%16.7%-9.2%136.5%
San Mateo$2,075,000$2,001,000$1,650,0003.7%25.8%-1.9%94.4%
Santa Clara$1,675,000$1,650,000$1,365,0001.5%22.7%-8.2%131.8%
Solano$579,000$555,000$482,0004.3%20.1%-7.5%10.3%
Sonoma$780,000$777,500$675,0000.3%15.6%-2.5%158.5%
Southern California
Los Angeles$725,680$718,440r$553,710r1.0%31.1%-3.1%80.7%
Orange$1,100,000$1,100,000$834,5500.0%31.8%-10.1%130.9%
Riverside$560,000$545,500$434,4802.7%28.9%-5.2%60.4%
San Bernardino$410,000$405,000$320,0001.2%28.1%-2.5%54.8%
San Diego$851,000$825,120$655,0003.1%29.9%-3.2%76.1%
Ventura$806,000$865,000$681,250-6.8%18.3%-7.8%119.5%
Central Coast
Monterey$887,000$840,000$650,0005.6%36.5%0.4%153.3%
San Luis Obispo$775,000$799,950$632,500-3.1%22.5%-10.4%99.3%
Santa Barbara$1,299,000$1,100,000$637,50018.1%103.8%-2.1%99.3%
Santa Cruz$1,300,000$1,265,000$850,0002.8%52.9%-4.9%110.9%
Central Valley
Fresno$361,500$355,000$295,0001.8%22.5%3.8%40.5%
Glenn$384,000$302,500$323,25026.9%18.8%-54.2%-8.3%
Kern$317,000$315,000$270,0000.6%17.4%-3.6%60.8%
Kings$315,000$305,000$249,9503.3%26.0%-17.4%13.6%
Madera$360,000$378,000$297,500-4.8%21.0%5.3%34.3%
Merced$350,000$325,000$285,0007.7%22.8%1.7%12.0%
Placer$663,450$625,000$515,0006.2%28.8%-2.3%53.1%
Sacramento$500,000$490,000$395,0002.0%26.6%-0.3%46.1%
San Benito$810,000$722,500$660,50012.1%22.6%-7.8%195.0%
San Joaquin$500,000$490,000$415,0002.0%20.5%10.0%55.7%
Stanislaus$440,000$419,000$350,0005.0%25.7%-5.7%37.8%
Tulare$324,350$309,600$255,2504.8%27.1%-1.2%17.4%
Far North
Butte$449,000$438,500$362,0002.4%24.0%-10.9%63.2%
Lassen$247,450$253,000$195,000-2.2%26.9%4.3%41.2%
Plumas$423,000$400,000$269,0005.8%57.2%31.7%260.0%
Shasta$360,000$350,000$297,0002.9%21.2%10.2%53.3%
Siskiyou$289,000$302,500$230,000-4.5%25.7%-25.9%10.3%
Tehama$348,000$362,000$290,000-3.9%20.0%11.9%51.6%
Other Calif. Counties
Amador$427,500$415,000$321,0003.0%33.2%2.9%80.0%
Calaveras$473,800$475,000$330,000-0.3%43.6%5.1%55.2%
Del Norte$415,000$364,170$338,45014.0%22.6%-59.1%-59.1%
El Dorado$688,000$654,750$535,0005.1%28.6%4.3%79.8%
Humboldt$400,000$425,000$340,750-5.9%17.4%18.3%84.3%
Lake$360,000$324,950$300,00010.8%20.0%-10.4%72.0%
Mariposa$415,000$343,200$280,00020.9%48.2%0.0%100.0%
Mendocino$602,500$528,000$426,00014.1%41.4%2.0%100.0%
Mono$1,140,000$974,000$520,15017.0%119.2%-25.0%400.0%
Nevada$563,250$555,000$410,0001.5%37.4%-11.2%42.9%
Sutter$410,000$410,000$342,5500.0%19.7%37.3%102.5%
Tuolumne$390,700$367,000$319,0006.5%22.5%7.2%103.9%
Yolo$617,500$566,000$443,0009.1%39.4%8.6%83.1%
Yuba$400,000$384,700$320,0004.0%25.0%37.8%100.0%

r = revised
NA = not available

May 2021 County Unsold Inventory and Days on Market
(Regional and condo sales data not seasonally adjusted)

May 2021Unsold Inventory IndexMedian Time on Market
State/Region/County
Calif. Single-family home1.81.64.37.07.017.0
Calif. Condo/Townhome1.71.55.38.09.018.0
Los Angeles Metro Area1.91.74.78.08.020.0
Central Coast2.01.86.49.08.017.0
Central Valley1.61.63.36.06.013.0
Far North2.52.55.711.011.027.5
Inland Empire1.91.74.48.08.025.0
San Francisco Bay Area1.51.33.88.08.017.0
Southern California1.81.64.57.07.018.0
San Francisco Bay Area
Alameda1.31.33.18.07.011.0
Contra Costa1.21.13.37.07.013.0
Marin1.51.34.611.011.029.0
Napa2.82.49.029.031.047.0
San Francisco1.81.63.711.011.020.5
San Mateo1.51.43.48.08.012.0
Santa Clara1.51.33.67.08.010.0
Solano1.41.13.021.020.031.0
Sonoma2.01.97.429.031.045.0
Southern California
Los Angeles2.01.84.38.07.016.0
Orange1.61.55.57.07.015.0
Riverside1.71.64.38.08.023.0
San Bernardino2.22.04.78.08.029.0
San Diego1.61.53.57.06.011.0
Ventura1.91.77.622.022.045.0
Central Coast
Monterey2.42.18.79.510.016.5
San Luis Obispo2.11.86.46.07.022.0
Santa Barbara1.61.65.69.08.012.0
Santa Cruz2.01.75.410.09.018.5
Central Valley
Fresno1.71.83.36.06.013.0
Glenn3.61.35.48.07.535.0
Kern1.71.73.56.06.015.0
Kings1.61.52.35.06.020.5
Madera2.22.34.88.58.029.0
Merced1.71.73.17.07.014.0
Placer1.41.43.56.05.014.0
Sacramento1.41.42.96.06.09.0
San Benito2.02.19.19.010.032.5
San Joaquin1.61.73.67.06.016.0
Stanislaus1.71.53.26.06.014.0
Tulare1.71.72.97.08.017.0
Far North
Butte2.11.74.37.07.021.0
Lassen5.95.77.767.071.5119.0
Plumas3.64.322.961.0100.0181.0
Shasta2.22.44.88.07.018.0
Siskiyou3.52.66.47.59.024.0
Tehama2.63.36.332.044.555.0
Other Calif. Counties
Amador2.22.07.48.59.038.5
Calaveras2.42.26.448.550.078.0
Del Norte9.93.16.067.0165.0113.0
El Dorado1.71.75.47.09.032.0
Humboldt2.32.76.37.09.019.0
Lake3.83.07.69.017.078.5
Mariposa3.03.29.310.06.045.0
Mendocino3.94.112.638.540.053.0
Mono3.72.427.061.073.080.0
Nevada2.32.25.48.09.029.0
Sutter1.71.43.57.06.017.0
Tuolumne3.03.07.69.010.035.0
Yolo1.51.54.77.07.016.0
Yuba1.61.23.86.05.018.0

r = revised
NA = not available

SOURCE CALIFORNIA ASSOCIATION OF REALTORS® (C.A.R.)