CoreLogic Loan Performance Insights Finds Declining Mortgage Delinquency Rates for April as States Impacted by 2017 Hurricanes Continue to Recover

  • Early-Stage Delinquencies Drop 0.4 Percentage Points Year Over Year in April
  • The Share of Home Loans Transitioning from Current to 30 Days Past Due is the Lowest for the Month of April Since 2000
  • Only Hurricane-Impacted States Are Experiencing Significant Serious Delinquency Rate Increases

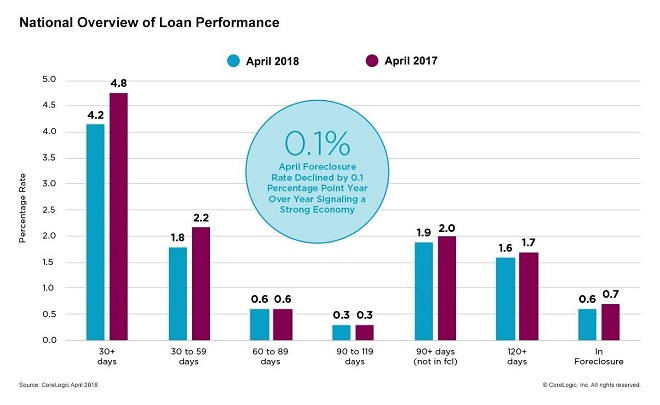
Irvine, CA – July 10, 2018 (BUSINESS WIRE) CoreLogic® (NYSE: CLGX), a leading global property information, analytics and data-enabled solutions provider, today released its monthly Loan Performance Insights Report. The report shows that, nationally, 4.2 percent of mortgages were in some stage of delinquency (30 days or more past due, including those in foreclosure) in April 2018, representing a 0.6 percentage point decline in the overall delinquency rate compared with April 2017, when it was 4.8 percent.

CoreLogic Logo

As of April 2018, the foreclosure inventory rate – which measures the share of mortgages in some stage of the foreclosure process – was 0.6 percent, down 0.1 percentage points from 0.7 percent in April 2017. Since August 2017, the foreclosure inventory rate has been steady at 0.6 percent, the lowest level since June 2007, when it was also 0.6 percent. The April 2018 foreclosure inventory rate was the lowest for that month in 11 years; it was also 0.6 percent in April 2007.

Measuring early-stage delinquency rates is important for analyzing the health of the mortgage market. To monitor mortgage performance comprehensively, CoreLogic examines all stages of delinquency, as well as transition rates, which indicate the percentage of mortgages moving from one stage of delinquency to the next.

The rate for early-stage delinquencies – defined as 30 to 59 days past due – was 1.8 percent in April 2018, down from 2.2 in April 2017. The share of mortgages that were 60 to 89 days past due in April 2018 was 0.6 percent, unchanged from April 2017. The serious delinquency rate – defined as 90 days or more past due, including loans in foreclosure – was 1.9 percent in April 2018, down from 2.0 percent in April 2017. The April 2018 serious delinquency rate was the lowest for that month since 2007 when it was 1.6 percent.

Chart

Chart

Chart

Chart

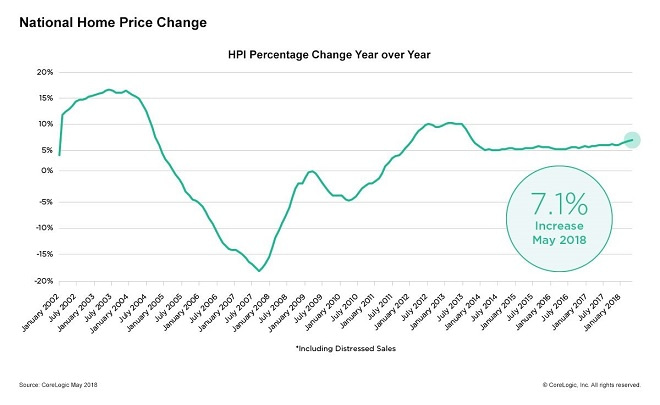
“Job growth, home-price appreciation, and full-doc underwriting have pushed delinquency and foreclosure rates to the lowest point in more than a decade,” said Dr. Frank Nothaft, chief economist for CoreLogic. “The latest CoreLogic Home Price Index report revealed the annual national home price growth was 7.1 percent in May, the fastest annual growth in four years. U.S. employers have also continued to employ more individuals, as employment rose by 2.4 million throughout the last 12 months with 213,000 jobs added last month alone. Together, this heightened financial stability is pushing delinquency and foreclosure rates to record lows.”

Since early-stage delinquencies can be volatile, CoreLogic also analyzes transition rates. The share of mortgages that transitioned from current to 30 days past due was 0.8 percent in April 2018, down from 1.2 percent in April 2017. By comparison, in January 2007, just before the start of the financial crisis, the current- to 30-day transition rate was 1.2 percent, while it peaked in November 2008 at 2 percent.

As a result of the 2017 hurricane season, Florida and Texas are the only states showing significant gains in 90-day delinquency rates. According to the CoreLogic Storm Surge Report, Florida has the most densely populated and longest coastal area and thus the most exposure to storm surge flooding (compared to the 19 states analyzed in the report) with more than 2.7 million at-risk homes across five risk categories (Category 1 – Category 5 storms). Louisiana ranks second with more than 817,000 at-risk homes, while Texas ranks third with more than 543,000 at-risk homes. A major storm did not strike Louisiana in 2017, but Florida and Texas are still recovering from Hurricanes Irma and Harvey, respectively.

“Delinquency rates are nearing historic lows, except in areas impacted by extreme weather over the past 18 months, reflecting a long period of strict underwriting practices and improved economic conditions,” said Frank Martell, president and CEO of CoreLogic. “Last year’s hurricanes and wildfires continue to affect today’s default rates. The percent of loans 90 days or more delinquent or in foreclosure are more than double what they were before last autumn’s hurricanes in Houston, Texas and Naples, Florida. The 90-day-plus delinquent or in-foreclosure rate has also quadrupled in Puerto Rico.”

For ongoing housing trends and data, visit the CoreLogic Insights Blog: www.corelogic.com/insights.

Methodology

The data in this report represents foreclosure and delinquency activity reported through April 2018.

The data in this report accounts for only first liens against a property and does not include secondary liens. The delinquency, transition and foreclosure rates are measured only against homes that have an outstanding mortgage. Homes without mortgage liens are not typically subject to foreclosure and are, therefore, excluded from the analysis. Approximately one-third of homes nationally are owned outright and do not have a mortgage. CoreLogic has approximately 85 percent coverage of U.S. foreclosure data.

Source: CoreLogic

The data provided is for use only by the primary recipient or the primary recipient’s publication or broadcast. This data may not be re-sold, republished or licensed to any other source, including publications and sources owned by the primary recipient’s parent company without prior written permission from CoreLogic. Any CoreLogic data used for publication or broadcast, in whole or in part, must be sourced as coming from CoreLogic, a data and analytics company. For use with broadcast or web content, the citation must directly accompany first reference of the data. If the data is illustrated with maps, charts, graphs or other visual elements, the CoreLogic logo must be included on screen or website. For questions, analysis or interpretation of the data, contact Alyson Austin at newsmedia@corelogic.com or Allyse Sanchez at corelogic@ink-co.com. Data provided may not be modified without the prior written permission of CoreLogic. Do not use the data in any unlawful manner. This data is compiled from public records, contributory databases and proprietary analytics, and its accuracy is dependent upon these sources.

About CoreLogic

CoreLogic (NYSE: CLGX) is a leading global property information, analytics and data-enabled solutions provider. The company’s combined data from public, contributory and proprietary sources includes over 4.5 billion records spanning more than 50 years, providing detailed coverage of property, mortgages and other encumbrances, consumer credit, tenancy, location, hazard risk and related performance information. The markets CoreLogic serves include real estate and mortgage finance, insurance, capital markets, and the public sector. CoreLogic delivers value to clients through unique data, analytics, workflow technology, advisory and managed services. Clients rely on CoreLogic to help identify and manage growth opportunities, improve performance and mitigate risk. Headquartered in Irvine, Calif., CoreLogic operates in North America, Western Europe and Asia Pacific. For more information, please visit www.corelogic.com.

CORELOGIC and the CoreLogic logo are trademarks of CoreLogic, Inc. and/or its subsidiaries.

Contacts

CoreLogic
Alyson Austin
Corporate Communications
(949) 214-1414
newsmedia@corelogic.com

or

INK Communications
Allyse Sanchez
(925) 548-2535
corelogic@ink-co.com

CoreLogic Reports May Home Prices Increased by 7.1 Percent, Consumers Express Desire to Buy Despite High Prices

  • In Hottest Markets, Renters’ Desire to Buy Outpaces Available Sellers by Four Times
  • Washington, Nevada, Idaho and Utah Post Double-digit 12-month Price Growth
  • Home Prices Projected to Increase by 5.1 Percent by May 2019

Irvine, CA – July 3rd, 2018 (BUSINESS WIRE) CoreLogic® (NYSE: CLGX), a leading global property information, analytics and data-enabled solutions provider, today released the CoreLogic Home Price Index (HPI™) and HPI Forecast™ for May 2018, which shows home prices rose both year over year and month over month. Home prices increased nationally by 7.1 percent year over year from May 2017 to May 2018. On a month-over-month basis, prices increased by 1.1 percent in May 2018 – compared with April 2018 – according to the CoreLogic HPI. (April 2018 data was revised. Revisions with public records data are standard, and to ensure accuracy, CoreLogic incorporates the newly released public data to provide updated results each month.)

CoreLogic Logo

Looking ahead, the CoreLogic HPI Forecast indicates that the national home-price index is projected to continue to increase by 5.1 percent on a year-over-year basis from May 2018 to May 2019. On a month-over-month basis, home prices are expected to rise 0.3 percent in June 2018. The CoreLogic HPI Forecast is a projection of home prices that is calculated using the CoreLogic HPI and other economic variables. Values are derived from state-level forecasts by weighting indices according to the number of owner-occupied households for each state.

“The lean supply of homes for sale is leading to higher sales prices and fewer days on market, and the supply shortage is more acute for entry-level homes,” said Dr. Frank Nothaft, chief economist for CoreLogic. “During the first quarter, we found that about 50 percent of all existing homeowners had a mortgage rate of 3.75 percent or less. May’s mortgage rates averaged a seven-year high of 4.6 percent, with an increasing number of homeowners keeping the low-rate loans they currently have, rather than sell and buy another home that would carry a higher interest rate.”

Chart 1

Chart 2

Chart 3

Chart 4

According to the CoreLogic Market Condition Indicators (MCI), an analysis of housing values in the country’s 100 largest metropolitan areas based on housing stock found that 40 percent of metropolitan areas have an overvalued housing market as of May 2018. The MCI analysis categorizes home prices in individual markets as undervalued, at value or overvalued, by comparing home prices to their long-run, sustainable levels, which are supported by local market fundamentals (such as disposable income). Additionally, as of May 2018, 26 percent of the top 100 metropolitan areas were undervalued and 34 percent were at value. When looking at only the top 50 markets based on housing stock, 52 percent were overvalued, 14 percent were undervalued and 34 percent were at value. The MCI analysis defines an overvalued housing market as one in which home prices are at least 10 percent higher than the long-term, sustainable level. An undervalued housing market is one in which home prices are at least 10 percent below the sustainable level.

In 2018, CoreLogic together with RTi Research of Norwalk, Connecticut, conducted an extensive consumer housing sentiment study, combining consumer and property insights. The study assessed attitudes toward homeownership and the drivers of the homebuying or renting decision process. Across the U.S., 15 percent of homeowners and 28 percent of renters have indicated a desire to buy a home in the next 12 months, while only 11 percent have indicated a desire to sell.

The research reported the long-term desire for homeownership is much stronger among renters in markets that have the highest home-price growth. Lagging supply in these markets is likely to continue as fewer current homeowners are considering putting their homes on the market. Over the next 12 months, 41 percent of renters are considering buying while only 11 percent of homeowners are considering selling over that same period. That is nearly four times as many renters than homeowners, which is the crux of the available housing-supply imbalance.

“The CoreLogic consumer research demonstrates that, despite high home prices, renters want to get out of their rental property and purchase a home,” said Frank Martell, president and CEO of CoreLogic. “Even in the most expensive markets, we found four times as many renters looking to buy than homeowners willing to sell. Until more supply becomes available, we will continue to see soaring prices in cities such as Denver, San Francisco and Seattle.”

Methodology

The CoreLogic HPI™ is built on industry-leading public record, servicing and securities real-estate databases and incorporates more than 40 years of repeat-sales transactions for analyzing home price trends. Generally released on the first Tuesday of each month with an average five-week lag, the CoreLogic HPI is designed to provide an early indication of home price trends by market segment and for the “Single-Family Combined” tier, representing the most comprehensive set of properties, including all sales for single-family attached and single-family detached properties. The indices are fully revised with each release and employ techniques to signal turning points sooner. The CoreLogic HPI provides measures for multiple market segments, referred to as tiers, based on property type, price, time between sales, loan type (conforming vs. non-conforming) and distressed sales. Broad national coverage is available from the national level down to ZIP Code, including non-disclosure states.

CoreLogic HPI Forecasts™ are based on a two-stage, error-correction econometric model that combines the equilibrium home price—as a function of real disposable income per capita—with short-run fluctuations caused by market momentum, mean-reversion, and exogenous economic shocks like changes in the unemployment rate. With a 30-year forecast horizon, CoreLogic HPI Forecasts project CoreLogic HPI levels for two tiers — “Single-Family Combined” (both attached and detached) and “Single-Family Combined Excluding Distressed Sales.” As a companion to the CoreLogic HPI Forecasts, Stress-Testing Scenarios align with Comprehensive Capital Analysis and Review (CCAR) national scenarios to project five years of home prices under baseline, adverse and severely adverse scenarios at state, Core Based Statistical Area (CBSA) and ZIP Code levels. The forecast accuracy represents a 95-percent statistical confidence interval with a +/- 2 percent margin of error for the index.

About The 2018 CoreLogic Consumer Housing Sentiment Study

Nationwide survey of 3001 renters and homeowners conducted in first quarter of 2018 by CoreLogic together with RTi Research. The survey has a sampling error of +/- 1.8 percent at the total respondent level with a 95 percent confidence level.

About RTi Research

RTi Research is an innovative, global market research and brand strategy consultancy headquartered in Norwalk, CT. Founded in 1979, RTi has been consistently recognized by the American Marketing Association as one of the top 50 U.S. insights companies. The company serves a broad base of leading firms in Financial Services, Consumer Goods, and Pharmaceuticals as well as partnering with leading academic centers of excellence.

Source: CoreLogic

The data provided are for use only by the primary recipient or the primary recipient’s publication or broadcast. This data may not be resold, republished or licensed to any other source, including publications and sources owned by the primary recipient’s parent company without prior written permission from CoreLogic. Any CoreLogic data used for publication or broadcast, in whole or in part, must be sourced as coming from CoreLogic, a data and analytics company. For use with broadcast or web content, the citation must directly accompany first reference of the data. If the data are illustrated with maps, charts, graphs or other visual elements, the CoreLogic logo must be included on screen or website. For questions, analysis or interpretation of the data, contact Alyson Austin at newsmedia@corelogic.com or Allyse Sanchez at corelogic@ink-co.com. Data provided may not be modified without the prior written permission of CoreLogic. Do not use the data in any unlawful manner. The data are compiled from public records, contributory databases and proprietary analytics, and its accuracy is dependent upon these sources.

About CoreLogic

CoreLogic (NYSE: CLGX) is a leading global property information, analytics and data-enabled solutions provider. The company’s combined data from public, contributory and proprietary sources includes over 4.5 billion records spanning more than 50 years, providing detailed coverage of property, mortgages and other encumbrances, consumer credit, tenancy, location, hazard risk and related performance information. The markets CoreLogic serves include real estate and mortgage finance, insurance, capital markets, and the public sector. CoreLogic delivers value to clients through unique data, analytics, workflow technology, advisory and managed services. Clients rely on CoreLogic to help identify and manage growth opportunities, improve performance and mitigate risk. Headquartered in Irvine, Calif., CoreLogic operates in North America, Western Europe and Asia Pacific. For more information, please visit www.corelogic.com.

CORELOGIC, the CoreLogic logo, CoreLogic HPI and CoreLogic HPI Forecast are trademarks of CoreLogic, Inc. and/or its subsidiaries. All other trademarks are the property of their respective owners.

Contacts

Media Contacts:
Alyson Austin
CoreLogic
Corporate Communications
(949) 214-1414
newsmedia@corelogic.com

or

Allyse Sanchez
INK Communications
(925) 548-2535
corelogic@ink-co.com

CoreLogic March Loan Performance Insights Finds Lowest Delinquency Rates in 11 Years

  • Rising Home Equity and Employment Support Delinquency Decline
  • March Foreclosure Rate Declined 0.2 Percentage Points Year Over Year
  • Early-Stage Delinquency Rates Were Unchanged from March a Year Ago

Irvine, CA – June 12, 2018 (BUSINESS WIRE) CoreLogic® (NYSE: CLGX), a leading global property information, analytics and data-enabled solutions provider, today released its monthly Loan Performance Insights Report. The report shows that, nationally, 4.3 percent of mortgages were in some stage of delinquency (30 days or more past due, including those in foreclosure) in March 2018, representing a 0.1 percentage point decline in the overall delinquency rate, compared with March 2017 when it was 4.4 percent.

CoreLogic Logo

As of March 2018, the foreclosure inventory rate – which measures the share of mortgages in some stage of the foreclosure process – was 0.6 percent, down 0.2 percentage points from 0.8 percent in March 2017. Since August 2017, the foreclosure inventory rate has been steady at 0.6 percent, the lowest level since June 2007, when it was also 0.6 percent. The March 2018 foreclosure inventory rate was the lowest for that month in 11 years; it was also 0.6 percent in March 2007.

Measuring early-stage delinquency rates is important for analyzing the health of the mortgage market. To monitor mortgage performance comprehensively, CoreLogic examines all stages of delinquency, as well as transition rates, which indicate the percentage of mortgages moving from one stage of delinquency to the next.

The rate for early-stage delinquencies – defined as 30 to 59 days past due – was 1.7 percent in March 2018, unchanged from March 2017. The share of mortgages that were 60 to 89 days past due in March 2018 was 0.6 percent, also unchanged from March 2017. The serious delinquency rate – defined as 90 days or more past due, including loans in foreclosure – was 1.9 percent in March 2018, down from 2.1 percent in March 2017. The March 2018 serious delinquency rate was the lowest for that month since 2007 when it was 1.5 percent.

Chart 1

Chart 2

Chart 3

“Unemployment and lack of home equity are two factors that can lead to borrowers defaulting on their mortgages,” said Dr. Frank Nothaft, chief economist for CoreLogic. “Unemployment is at the lowest level in 18 years, and for the first quarter, the CoreLogic Equity Report revealed record levels of home equity growth with equity per owner up $16,300 on average for the year ending March 2018.”

Since early-stage delinquencies can be volatile, CoreLogic also analyzes transition rates. The share of mortgages that transitioned from current to 30 days past due was 0.7 percent in March 2018, up from 0.6 percent in March 2017. By comparison, in January 2007, just before the start of the financial crisis, the current- to 30-day transition rate was 1.2 percent, while it peaked in November 2008 at 2 percent.

“As we enter the summer, the risk of hurricane and wildfire damage to homes increases as does the risk of damage-related loan default,” said Frank Martell, president and CEO of CoreLogic. “Last year’s hurricanes and wildfires continue to affect today’s default rates. Serious delinquency rates are more than double what they were before last autumn’s hurricanes in Houston, Texas, and Naples, Florida. The serious delinquency rates have also quadrupled in Puerto Rico.”

For ongoing housing trends and data, visit the CoreLogic Insights Blog: www.corelogic.com/insights.

Methodology

The data in this report represents foreclosure and delinquency activity reported through March 2018.

The data in this report accounts for only first liens against a property and does not include secondary liens. The delinquency, transition and foreclosure rates are measured only against homes that have an outstanding mortgage. Homes without mortgage liens are not typically subject to foreclosure and are, therefore, excluded from the analysis. Approximately one-third of homes nationally are owned outright and do not have a mortgage. CoreLogic has approximately 85 percent coverage of U.S. foreclosure data.

Source: CoreLogic

The data provided is for use only by the primary recipient or the primary recipient’s publication or broadcast. This data may not be re-sold, republished or licensed to any other source, including publications and sources owned by the primary recipient’s parent company without prior written permission from CoreLogic. Any CoreLogic data used for publication or broadcast, in whole or in part, must be sourced as coming from CoreLogic, a data and analytics company. For use with broadcast or web content, the citation must directly accompany first reference of the data. If the data is illustrated with maps, charts, graphs or other visual elements, the CoreLogic logo must be included on screen or website. For questions, analysis or interpretation of the data, contact Alyson Austin at newsmedia@corelogic.com or Allyse Sanchez at corelogic@ink-co.com. Data provided may not be modified without the prior written permission of CoreLogic. Do not use the data in any unlawful manner. This data is compiled from public records, contributory databases and proprietary analytics, and its accuracy is dependent upon these sources.

About CoreLogic

CoreLogic (NYSE: CLGX) is a leading global property information, analytics and data-enabled solutions provider. The company’s combined data from public, contributory and proprietary sources includes over 4.5 billion records spanning more than 50 years, providing detailed coverage of property, mortgages and other encumbrances, consumer credit, tenancy, location, hazard risk and related performance information. The markets CoreLogic serves include real estate and mortgage finance, insurance, capital markets, and the public sector. CoreLogic delivers value to clients through unique data, analytics, workflow technology, advisory and managed services. Clients rely on CoreLogic to help identify and manage growth opportunities, improve performance and mitigate risk. Headquartered in Irvine, Calif., CoreLogic operates in North America, Western Europe and Asia Pacific. For more information, please visit www.corelogic.com.

CORELOGIC and the CoreLogic logo are trademarks of CoreLogic, Inc. and/or its subsidiaries.

Contacts

Media:
Alyson Austin
Corporate Communications
CoreLogic
(949) 214-1414
newsmedia@corelogic.com

or

Allyse Sanchez
INK Communications
(925) 548-2535
corelogic@ink-co.com