US Home Borrowers See First Annual Home Equity Losses Since 2012 in Q1 2023, But Overall Mortgage Performance Remains Strong

  • The average U.S. home loan borrower saw home equity decline by $5,400 year over year in the first quarter.
  • Mortgage holders in Western states saw the largest year-over-year home equity losses in the U.S., which reflects recent regional price changes.

Irvine, CA – June 08, 2023 (BUSINESS WIRE) CoreLogic®, a leading global property information, analytics and data-enabled solutions provider, today released the Homeowner Equity Report (HER) for the first quarter of 2023. The report shows that U.S. homeowners with mortgages (which account for roughly 63% of all properties) saw home equity decrease by 0.7% year over year, representing a collective loss of $108.4 billion, and an average loss of $5,400 per borrower since the first quarter of 2022.

In the first quarter of 2023, U.S. homeowners with a mortgage lost a small amount of equity year over year for the first time since early 2012, while national combined equity followed suit. As in the fourth quarter of 2022, Western states posted the largest annual home equity losses: Washington (-$74,300), California (-$59,600) and Utah (-$37,700). The equity losses in those states reflect decelerating home prices, with all three posting annual declines in February and March, according to CoreLogic’s Home Price Index.

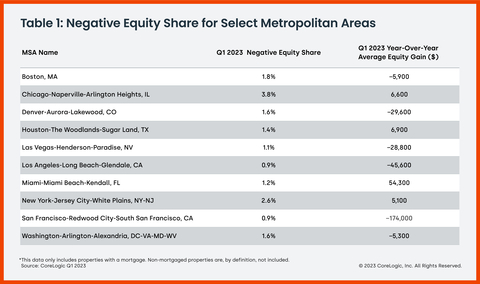
Despite these declines, home equity remains solid, with the number of underwater properties unchanged since the fourth quarter of 2022. And although some major metro areas saw equity decline on an annual basis, years of rapid appreciation in places like Los Angeles and San Francisco, which have negative equity shares of 0.9%, is keeping homeowners in these metros in good standing.

Figure 1: Map of Average Year-Over-Year Equity Gain per Borrower (Graphic: Business Wire)
Figure 2: National Home Equity Distribution by LTV Segment (Graphic: Business Wire)
Table 1: Negative Equity Share for Select Metropolitan Areas (Graphic: Business Wire)

“Home equity trends closely follow home price changes,” said CoreLogic Chief Economist Selma Hepp. “As a result, while the average amount of equity declined from a year ago, it increased from the fourth quarter of 2022, as monthly home prices growth accelerated in early 2023.”

“The average U.S. homeowner now has more than $274,000 in equity — up significantly from $182,000 before the pandemic,” Hepp continued. “Also, while homeowners in some areas of the country who bought a property last spring have no equity as a result of price losses, forecasted home price appreciation over the next year should help many borrowers regain some of that lost equity.”

Negative equity, also referred to as underwater or upside-down mortgages, applies to borrowers who owe more on their mortgages than their homes are currently worth. As of the first quarter of 2023, the quarterly and annual changes in negative equity were:

  • Quarterly change: From the fourth quarter of 2022 to the first quarter of 2023, the total number of mortgaged homes in negative equity was unchanged, remaining at 1.2 million homes or 2.1% of all mortgaged properties.
  • Annual change: From the first quarter of 2022 to the first quarter of 2023, the total number of homes in negative equity increased by 4% from 1.1 million homes or 2% of all mortgaged properties.

Because home equity is affected by home price changes, borrowers with equity positions near (+/- 5%), the negative equity cutoff, are most likely to move out of or into negative equity as prices change, respectively. Looking at the first quarter of 2023 book of mortgages, if home prices increase by 5%, 145,000 homes would regain equity; if home prices decline by 5%, 213,000 properties would fall underwater.

The next CoreLogic Homeowner Equity Report will be released in September 2023, featuring data for Q2 2023. For ongoing housing trends and data, visit the CoreLogic Intelligence Blog: www.corelogic.com/intelligence.

Methodology

The amount of equity for each property is determined by comparing the estimated current value of the property against the mortgage debt outstanding (MDO). If the MDO is greater than the estimated value, then the property is determined to be in a negative equity position. If the estimated value is greater than the MDO, then the property is determined to be in a positive equity position. The data is first generated at the property level and aggregated to higher levels of geography. CoreLogic uses public record data as the source of the MDO, which includes more than 50 million first- and second mortgage liens and is adjusted for amortization and home equity utilization in order to capture the true level of MDO for each property. Only data for mortgaged residential properties that have a current estimated value are included. There are several states or jurisdictions where the public record, current value or mortgage data coverage is thin and have been excluded from the analysis. These instances account for fewer than 5% of the total U.S. population. The percentage of homeowners with a mortgage is from the 2019 American Community Survey. Data for the previous quarter was revised. Revisions with public records data are standard, and to ensure accuracy, CoreLogic incorporates the newly released public data to provide updated results.

Source: CoreLogic

The data provided is for use only by the primary recipient or the primary recipient’s publication or broadcast. This data may not be re-sold, republished or licensed to any other source, including publications and sources owned by the primary recipient’s parent company without prior written permission from CoreLogic. Any CoreLogic data used for publication or broadcast, in whole or in part, must be sourced as coming from CoreLogic, a data and analytics company. For use with broadcast or web content, the citation must directly accompany first reference of the data. If the data is illustrated with maps, charts, graphs or other visual elements, the CoreLogic logo must be included on screen or website. For questions, analysis or interpretation of the data, contact Robin Wachner at newsmedia@corelogic.com. For sales inquiries, please visit https://www.corelogic.com/support/sales-contact/. Data provided may not be modified without the prior written permission of CoreLogic. Do not use the data in any unlawful manner. This data is compiled from public records, contributory databases and proprietary analytics, and its accuracy is dependent upon these sources.

About CoreLogic

CoreLogic is a leading global property information, analytics and data-enabled solutions provider. The company’s combined data from public, contributory and proprietary sources includes over 4.5 billion records spanning more than 50 years, providing detailed coverage of property, mortgages and other encumbrances, consumer credit, tenancy, location, hazard risk and related performance information. The markets CoreLogic serves include real estate and mortgage finance, insurance, capital markets, and the public sector. CoreLogic delivers value to clients through unique data, analytics, workflow technology, advisory and managed services. Clients rely on CoreLogic to help identify and manage growth opportunities, improve performance and mitigate risk. Headquartered in Irvine, Calif., CoreLogic operates in North America, Western Europe and Asia Pacific. For more information, please visit www.corelogic.com.

CORELOGIC and the CoreLogic logo are trademarks of CoreLogic, Inc. and/or its subsidiaries. All other trademarks are the property of their respective owners.

Contacts

Media Contact:
Robin Wachner
newsmedia@corelogic.com

Sales Contact:
https://www.corelogic.com/support/sales-contact/

CoreLogic: Home Price Growth Continues Annual Single-Digit Slowdown in April

  • April’s 2% year-over-year home price growth was the lowest recorded since March 2012
  • CoreLogic’s forecast suggests that all states will again show positive annual home price gains by April 2024

Irvine, CA – June 06, 2023 (BUSINESS WIRE) CoreLogic®, a leading global property information, analytics and data-enabled solutions provider, today released the CoreLogic Home Price Index (HPI) and HPI Forecast for April 2023.

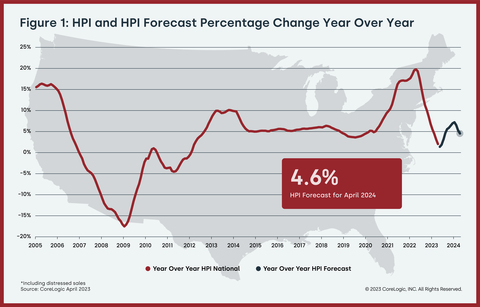
Nationwide, single-family home price growth rose by 2% year over year in April. This marked the 135th consecutive month of annual growth but the sixth straight month of single-digit gains, which have slowed from an all-time high of nearly 20% annual appreciation in the spring of 2022.

Numerous economic concerns are contributing to buyer reluctance, including mortgage rate volatility and the related uncertainty surrounding the recent debt-ceiling debate. That said, a continued shortage of homes for sale could keep pressure on housing prices over the next 12 months. CoreLogic projects that home price growth will slow a bit more in 2023 before regaining steam to about 5% annual appreciation by April 2024.

Figure 1: HPI & HPI Forecast Percentage Change YOY (Graphic: Business Wire)
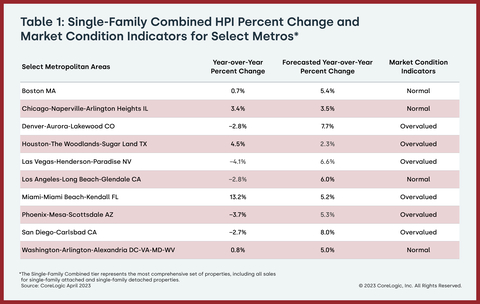
Table 1: Single-Family Combined HPI Percent Change & Market Condition Indicators for Select Metros (Graphic: Business Wire)
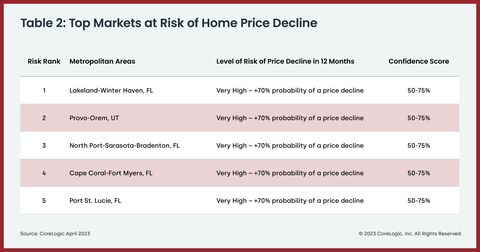
Table 2: Top Markets at Risk of Home Price Decline (Graphic: Business Wire)

“While mortgage rate volatility continues to cause buyer hesitation, the lack of for-sale homes is putting firm pressure on prices this spring, leading to above-average seasonal monthly gains and a rebound in home prices in most markets,” said CoreLogic Chief Economist Selma Hepp. ”Nevertheless, the recent surge in mortgage rates and continued inflation issues suggest that rates may remain elevated, leading home price appreciation to possibly relax this summer and return to average seasonal gains later in 2023.”

“Still, while slim inventory is pushing prices up once again and constraining affordability,” Hepp continued, “recent trends suggest that home price growth in 2023 will fall in line with the historical 4% annual average.“

Top Takeaways:

  • U.S. home prices (including distressed sales) increased by 2% year over year in April 2023 compared with April 2022. On a month-over-month basis, home prices increased by 1.2% compared with March 2023.
  • In April, the annual appreciation of attached properties (3.6%) was 2.1 percentage points higher than that of detached properties (1.5%).
  • CoreLogic forecasts show annual U.S. home price gains increasing to 4.6% by April 2024.
  • Miami posted the highest year-over-year home price increase of the country’s 20 tracked metro areas in April, at 13.2%, while Atlanta ranked second at 4.8%.
  • Among states, Indiana and New Jersey recorded the highest annual home price gains, 7.3% and 7.1%, respectively. Missouri, South Carolina and Vermont posted the third-highest growth rates, with all showing a 6.9% year-over-year increase. Ten states recorded annual losses: Washington (-7.7%), Idaho (-5.9%), Utah (-4.9%), Nevada (-4.5%), California (-3.6%), Arizona (-2.6%), Oregon (-2.6%), Colorado (-2.1%), Montana (-1.1%) and New York (-1.1%).

The next CoreLogic HPI press release, featuring May 2023 data, will be issued on July 11, 2023, at 8 a.m. EST.

Methodology

The CoreLogic HPI is built on industry-leading public record, servicing and securities real-estate databases and incorporates more than 45 years of repeat-sales transactions for analyzing home price trends. Generally released on the first Tuesday of each month with an average five-week lag, the CoreLogic HPI is designed to provide an early indication of home price trends by market segment and for the Single-Family Combined tier, representing the most comprehensive set of properties, including all sales for single-family attached and single-family detached properties. The indices are fully revised with each release and employ techniques to signal turning points sooner. The CoreLogic HPI provides measures for multiple market segments, referred to as tiers, based on property type, price, time between sales, loan type (conforming vs. non-conforming) and distressed sales. Broad national coverage is available from the national level down to ZIP Code, including non-disclosure states.

CoreLogic HPI Forecasts are based on a two-stage, error-correction econometric model that combines the equilibrium home price—as a function of real disposable income per capita—with short-run fluctuations caused by market momentum, mean-reversion, and exogenous economic shocks like changes in the unemployment rate. With a 30-year forecast horizon, CoreLogic HPI Forecasts project CoreLogic HPI levels for two tiers — Single-Family Combined (both attached and detached) and Single-Family Combined Excluding Distressed Sales. As a companion to the CoreLogic HPI Forecasts, Stress-Testing Scenarios align with Comprehensive Capital Analysis and Review (CCAR) national scenarios to project five years of home prices under baseline, adverse and severely adverse scenarios at state, metropolitan areas and ZIP Code levels. The forecast accuracy represents a 95% statistical confidence interval with a +/- 2% margin of error for the index.

About Market Risk Indicators

Market Risk Indicators are a subscription-based analytics solution that provide monthly updates on the overall health of housing markets across the country. CoreLogic data scientists combine world-class analytics with detailed economic and housing data to help determine the likelihood of a housing bubble burst in 392 major metros and all 50 states. Market Risk Indicators is a multi-phase regression model that provides a probability score (from 1 to 100) on the likelihood of two scenarios per metro: a >10% price reduction and a ≤ 10% price reduction. The higher the score, the higher the risk of a price reduction.

About the Market Condition Indicators

As part of the CoreLogic HPI and HPI Forecasts offerings, Market Condition Indicators are available for all metropolitan areas and identify individual markets as overvalued, at value or undervalued. These indicators are derived from the long-term fundamental values, which are a function of real disposable income per capita. Markets are labeled as overvalued if the current home price indexes exceed their long-term values by greater than 10% and undervalued where the long-term values exceed the index levels by greater than 10%.

Source: CoreLogic

The data provided are for use only by the primary recipient or the primary recipient’s publication or broadcast. This data may not be resold, republished or licensed to any other source, including publications and sources owned by the primary recipient’s parent company without prior written permission from CoreLogic. Any CoreLogic data used for publication or broadcast, in whole or in part, must be sourced as coming from CoreLogic, a data and analytics company. For use with broadcast or web content, the citation must directly accompany first reference of the data. If the data are illustrated with maps, charts, graphs or other visual elements, the CoreLogic logo must be included on screen or website. For questions, analysis or interpretation of the data, contact Robin Wachner at newsmedia@corelogic.com. For sales inquiries, visit https://www.corelogic.com/support/sales-contact/. Data provided may not be modified without the prior written permission of CoreLogic. Do not use the data in any unlawful manner. The data are compiled from public records, contributory databases and proprietary analytics, and its accuracy is dependent upon these sources.

About CoreLogic

CoreLogic is a leading global property information, analytics and data-enabled solutions provider. The company’s combined data from public, contributory and proprietary sources includes over 4.5 billion records spanning more than 50 years, providing detailed coverage of property, mortgages and other encumbrances, consumer credit, tenancy, location, hazard risk and related performance information. The markets CoreLogic serves include real estate and mortgage finance, insurance, capital markets, and the public sector. CoreLogic delivers value to clients through unique data, analytics, workflow technology, advisory and managed services. Clients rely on CoreLogic to help identify and manage growth opportunities, improve performance and mitigate risk. Headquartered in Irvine, Calif., CoreLogic operates in North America, Western Europe and Asia Pacific. For more information, please visit www.corelogic.com.

CORELOGIC, the CoreLogic logo, CoreLogic HPI and CoreLogic HPI Forecast are trademarks of CoreLogic, Inc. and/or its subsidiaries. All other trademarks are the property of their respective owners.

Contacts

Media Contact:
Robin Wachner
newsmedia@corelogic.com

Sales Contact:
https://www.corelogic.com/support/sales-contact/
S&P CoreLogic Case-Shiller Index Rebound Continued In March

New York, NY – May 30, 2023 (PRNewswire) S&P Dow Jones Indices (S&P DJI) today released the latest results for the S&P CoreLogic Case-Shiller Indices, the leading measure of U.S. home prices. Data released today for March 2023 show a continuing recovery in housing prices, as all 20 major metro markets reported month-over-month price increases. More than 27 years of history are available for the data series and can be accessed in full by going to www.spglobal.com/spdji/en/index-family/indicators/sp-corelogic-case-shiller.

YEAR-OVER-YEAR

The S&P CoreLogic Case-Shiller U.S. National Home Price NSA Index, covering all nine U.S. census divisions, reported a 0.7% annual gain in March, down from 2.1% in the previous month. The 10-City Composite showed a decrease of -0.8%, down from 0.5% increase in the previous month. The 20-City Composite posted a -1.1% year-over-year loss, down from a 0.4% gain in the previous month.

Miami, Tampa, and Charlotte reported the highest year-over-year gains among the 20 cities in March. Miami led the way once again with a 7.7% year-over-year price increase, followed by Tampa in second with a 4.8% increase, and Charlotte replacing Atlanta in third with a 4.7% increase. There are 19 of 20 cities reporting lower prices in the year ending March 2023 versus the year ending February 2023, with only Chicago showing an increase at 0.4%. 

MONTH-OVER-MONTH

Before seasonal adjustment, the U.S. National Index posted a 1.3% month-over-month increase in March, while the 10-City and 20-City Composites posted increases of 1.6% and 1.5%, respectively.

After seasonal adjustment, the U.S. National Index posted a month-over-month increase of 0.4%, while the 10-City Composite gained 0.6% and 20-City Composites posted an increase of 0.5%.

ANALYSIS

“The modest increases in home prices we saw a month ago accelerated in March 2023,” says Craig J. Lazzara, Managing Director at S&P DJI. “The National Composite rose by 1.3% in March, and now stands only 3.6% below its June 2022 peak.  Our 10- and 20-City Composites performed similarly, with March gains of 1.6% and 1.5% respectively.  On a trailing 12-month basis, the National Composite is only 0.7% above its level in March 2022, with the 10- and 20-City Composites modestly negative on a year-over-year basis. 

“The acceleration we observed nationally was also apparent at a more granular level.  Before seasonal adjustment, prices rose in all 20 cities in March (versus in 12 in February), and in all 20 price gains accelerated between February and March.  Seasonally adjusted data showed 15 cities with rising prices in March (versus 11 in February), with acceleration in 14 cities.

“One of the most interesting aspects of our report continues to lie in its stark regional differences.  Miami’s 7.7% year-over-year gain made it the best-performing city for the eighth consecutive month. Tampa (+4.8%) continued in second place, narrowly ahead of bronze medalist Charlotte (+4.7%).  The farther west we look, the weaker prices are, with Seattle (-12.4%) now leading San Francisco (-11.2%) at the bottom of the league table.  It’s unsurprising that the Southeast (+5.4%) remains the country’s strongest region, while the West (-6.2%) remains the weakest.

“Two months of increasing prices do not a definitive recovery make, but March’s results suggest that the decline in home prices that began in June 2022 may have come to an end.  That said, the challenges posed by current mortgage rates and the continuing possibility of economic weakness are likely to remain a headwind for housing prices for at least the next several months.”

Table 1 below shows the housing boom/bust peaks and troughs for the three composites along with the current levels and percentage changes from the peaks and troughs.

2006 Peak2012 TroughCurrent
IndexLevelDateLevelDateFrom Peak (%)LevelFrom Trough
(%)
From Peak
(%)
National184.61Jul-06134.00Feb-12-27.4 %297.08121.7 %60.9 %
20-City206.52Jul-06134.07Mar-12-35.1 %302.30125.5 %46.4 %
10-City226.29Jun-06146.45Mar-12-35.3 %315.34115.3 %39.4 %

Table 2 below summarizes the results for March 2023. The S&P CoreLogic Case-Shiller Indices could be revised for the prior 24 months, based on the receipt of additional source data.

March 2023March/FebruaryFebruary/January1-Year
Metropolitan AreaLevelChange (%)Change (%)Change (%)
Atlanta229.531.1 %0.4 %4.5 %
Boston302.131.3 %0.1 %0.8 %
Charlotte254.341.7 %0.0 %4.7 %
Chicago185.011.9 %0.0 %4.0 %
Cleveland170.070.6 %0.0 %2.0 %
Dallas284.691.1 %0.0 %-1.2 %
Denver309.002.0 %0.8 %-3.6 %
Detroit168.742.2 %-0.2 %1.2 %
Las Vegas268.490.5 %-0.9 %-5.1 %
Los Angeles398.721.7 %0.9 %-2.9 %
Miami400.180.7 %-0.4 %7.7 %
Minneapolis227.902.0 %0.0 %0.5 %
New York272.981.3 %-0.2 %3.3 %
Phoenix309.240.5 %0.1 %-4.5 %
Portland316.841.4 %-0.1 %-4.6 %
San Diego394.172.5 %1.5 %-5.3 %
San Francisco339.303.0 %1.0 %-11.2 %
Seattle352.442.0 %-0.3 %-12.4 %
Tampa368.001.0 %0.0 %4.8 %
Washington300.651.5 %0.4 %-0.2 %
Composite-10315.341.6 %0.4 %-0.8 %
Composite-20302.301.5 %0.3 %-1.1 %
U.S. National297.081.3 %0.3 %0.7 %
Sources: S&P Dow Jones Indices and CoreLogic
Data through March 2023

Table 3 below shows a summary of the monthly changes using the seasonally adjusted (SA) and non-seasonally adjusted (NSA) data. Since its launch in early 2006, the S&P CoreLogic Case-Shiller Indices have published, and the markets have followed and reported on, the non-seasonally adjusted data set used in the headline indices. For analytical purposes, S&P Dow Jones Indices publishes a seasonally adjusted data set covered in the headline indices, as well as for the 17 of 20 markets with tiered price indices and the five condo markets that are tracked.

March/February Change (%)February/January Change (%)
Metropolitan AreaNSASANSASA
Atlanta1.1 %0.4 %0.4 %0.4 %
Boston1.3 %0.0 %0.1 %0.2 %
Charlotte1.7 %0.8 %0.0 %0.1 %
Chicago1.9 %0.9 %0.0 %0.3 %
Cleveland0.6 %-0.2 %0.0 %0.3 %
Dallas1.1 %-0.1 %0.0 %-0.3 %
Denver2.0 %0.0 %0.8 %0.3 %
Detroit2.2 %1.4 %-0.2 %-0.3 %
Las Vegas0.5 %-0.4 %-0.9 %-0.9 %
Los Angeles1.7 %0.4 %0.9 %0.5 %
Miami0.7 %0.2 %-0.4 %-0.1 %
Minneapolis2.0 %1.0 %0.0 %-0.1 %
New York1.3 %1.1 %-0.2 %-0.1 %
Phoenix0.5 %-0.4 %0.1 %0.1 %
Portland1.4 %0.3 %-0.1 %-0.4 %
San Diego2.5 %1.0 %1.5 %0.1 %
San Francisco3.0 %0.7 %1.0 %-0.3 %
Seattle2.0 %-0.9 %-0.3 %-1.5 %
Tampa1.0 %0.3 %0.0 %0.0 %
Washington1.5 %0.5 %0.4 %0.2 %
Composite-101.6 %0.6 %0.4 %0.0 %
Composite-201.5 %0.5 %0.3 %-0.1 %
U.S. National1.3 %0.4 %0.3 %0.3 %
Sources: S&P Dow Jones Indices and CoreLogic
Data through March 2023

For more information about S&P Dow Jones Indices, please visit www.spglobal.com/spdji.

ABOUT S&P DOW JONES INDICES

S&P Dow Jones Indices is the largest global resource for essential index-based concepts, data and research, and home to iconic financial market indicators, such as the S&P 500® and the Dow Jones Industrial Average®. More assets are invested in products based on our indices than products based on indices from any other provider in the world. Since Charles Dow invented the first index in 1884, S&P DJI has been innovating and developing indices across the spectrum of asset classes helping to define the way investors measure and trade the markets.

S&P Dow Jones Indices is a division of S&P Global (NYSE: SPGI), which provides essential intelligence for individuals, companies, and governments to make decisions with confidence. For more information, visit www.spglobal.com/spdji.

FOR MORE INFORMATION:

April Kabahar
Global Head of Communications
New York, USA
(+1) 212 438 7530
april.kabahar@spglobal.com

S&P Dow Jones Indices’ interactive blog, IndexologyBlog.com, delivers real-time commentary and analysis from industry experts across S&P Global on a wide-range of topics impacting residential home prices, homebuilding and mortgage financing in the United States. Readers and viewers can visit the blog at www.indexologyblog.com, where feedback and commentary are welcomed and encouraged.

The S&P CoreLogic Case-Shiller Indices are published on the last Tuesday of each month at 9:00 am ET. They are constructed to accurately track the price path of typical single-family homes located in each metropolitan area provided. Each index combines matched price pairs for thousands of individual houses from the available universe of arms-length sales data. The S&P CoreLogic Case-Shiller U.S. National Home Price Index tracks the value of single-family housing within the United States. The index is a composite of single-family home price indices for the nine U.S. Census divisions and is calculated quarterly. The S&P CoreLogic Case-Shiller 10-City Composite Home Price Index is a value-weighted average of the 10 original metro area indices. The S&P CoreLogic Case-Shiller 20-City Composite Home Price Index is a value-weighted average of the 20 metro area indices. The indices have a base value of 100 in January 2000; thus, for example, a current index value of 150 translates to a 50% appreciation rate since January 2000 for a typical home located within the subject market.

These indices are generated and published under agreements between S&P Dow Jones Indices and CoreLogic, Inc.

The S&P CoreLogic Case-Shiller Indices are produced by CoreLogic, Inc. In addition to the S&P CoreLogic Case-Shiller Indices, CoreLogic also offers home price index sets covering thousands of zip codes, counties, metro areas, and state markets. The indices, published by S&P Dow Jones Indices, represent just a small subset of the broader data available through CoreLogic.

Case-Shiller® and CoreLogic® are trademarks of CoreLogic Case-Shiller, LLC or its affiliates or subsidiaries (“CoreLogic”) and have been licensed for use by S&P Dow Jones Indices. None of the financial products based on indices produced by CoreLogic or its predecessors in interest are sponsored, sold, or promoted by CoreLogic, and neither CoreLogic nor any of its affiliates, subsidiaries, or predecessors in interest makes any representation regarding the advisability of investing in such products.

SOURCE S&P Dow Jones Indices