Houston, Dallas, Denver, San Jose, San Antonio Prices 50+ Percent Above Previous Peaks; Average U.S. Homeownership Tenure Posts Biggest Quarterly Drop Since Q4 2008; Report Includes Analysis of High-End Sales in Wake of Tax Reform
Irvine, CA – April 19, 2018 (PRNewswire) ATTOM Data Solutions, curator of the nation’s premier property database, today released its Q1 2018 U.S. Home Sales Report, which shows that median home prices in 57 of 105 metropolitan statistical areas analyzed in the report (54 percent) were above their pre-recession home price peaks in the first quarter.

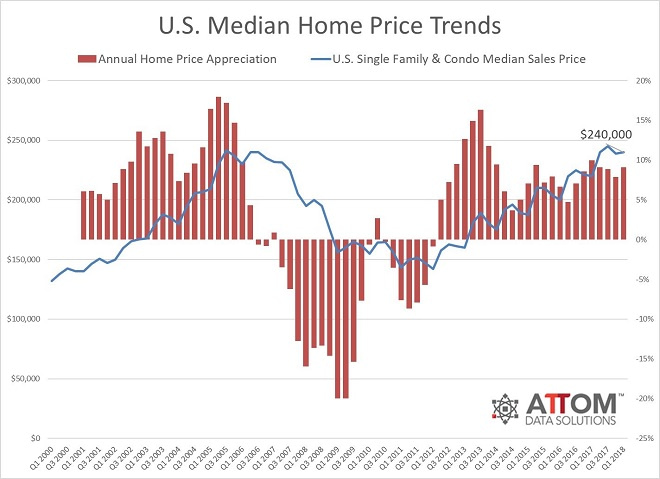
Nationwide the median home price of $240,000 in Q1 2018 was less than 1 percent below its pre-recession peak of $241,500 in Q3 2005, but still up 9.1 percent from a year ago. Metro areas with Q1 2018 median home prices the furthest above their pre-recession peaks were Houston, Texas (69 percent above); Dallas-Fort Worth, Texas (67 percent above); Denver, Colorado (62 percent above); San Jose, California (60 percent above); and San Antonio, Texas (57 percent above).
Other major metros with at least 1 million people and with Q1 2018 median home prices at least 30 percent above pre-recession peaks were Nashville, Tennessee (46 percent above); Austin, Texas (45 percent above); Salt Lake City, Utah (42 percent above); Raleigh, North Carolina (35 percent above); Indianapolis, Indiana (31 percent above); and Oklahoma City, Oklahoma (30 percent above).
“Rising interest rates and recently enacted tax reform that removed some tax incentives for homeownership were not enough to cool off red-hot home price appreciation in many parts of the country, with 30 of the 105 local markets analyzed posting double-digit gains in median home prices in the first quarter,” said Daren Blomquist, senior vice president at ATTOM Data Solutions. “Home prices are still below pre-recession peaks in 46 percent of local markets, but nearly one-third of even those markets posted double-digit home price appreciation in the first quarter.”

Prices in Philadelphia, Hartford, Chicago, Baltimore, Tucson still below pre-recession peaks
Median home prices in 48 of the 105 metro areas analyzed in the report (46 percent) were still below pre-recession peaks in Q1 2018, led by Bridgeport-Stamford-Norwalk, Connecticut (25 percent below); New Haven, Connecticut (22 percent below); Allentown, Pennsylvania (21 percent below); Philadelphia, Pennsylvania (20 percent below); and Hartford, Connecticut (19 percent below).
Along with Philadelphia and Hartford, other major metros with at least 1 million people and with Q1 2018 median home prices at least 15 percent below pre-recession peaks were Chicago, Illinois (19 percent below); Baltimore, Maryland (17 percent below); Tucson, Arizona (16 percent below); Las Vegas, Nevada (16 percent below); and New York-Newark-Jersey City (15 percent below).
San Jose, Flint, Spokane, Reno, Seattle post biggest annual home price increases
Among the 105 metropolitan statistical areas analyzed in the report, those posting the biggest year-over-year increase in median home prices were San Jose, California (up 33 percent); Flint, Michigan (up 20 percent); Spokane, Washington (up 18 percent); Reno, Nevada (up 17 percent); and Seattle, Washington (up 16 percent).
“In 2018 and in the next couple of years, we’ll see more markets where home prices are entering boom territory. It’s strange to say after so many years of stagnation, but buyers will want to beware right now in Denver, Miami, the LA area, Austin, San Francisco, Tampa and Seattle, where home prices are already 25 percent higher than they should be,” said Ingo Winzer, founder and president at Local Market Monitor. “We don’t think a bust is imminent — in fact we think prices in these markets will keep going up for several years — but dynamics like this have always ended badly in the past. If you’re thinking of selling, this year or next would be a good time. If you’re thinking of buying, either have a very short-term outlook or a very long one.”
Homeownership tenure posts largest quarterly drop since Q4 2008
U.S. homeowners who sold in Q1 2018 had been in their homes an average of 8.00 years, down 2 percent from 8.14 years in Q4 2017 — the biggest quarterly drop in average homeownership tenure since Q4 2008 — but still up from 7.69 years in Q1 2017.
Among 40 metropolitan statistical areas with a population of at least 1 million, those with the biggest quarterly drop in average homeownership tenure were Cleveland, Ohio (down 6 percent); Seattle, Washington (down 6 percent); Salt Lake City, Utah (down 5 percent); Minneapolis-St. Paul, Minnesota (down 4 percent); and Sacramento, California (down 4 percent).
Average home seller gains down from previous quarter, up from year ago
U.S. homeowners who sold in Q1 2018 realized an average home price gain since purchase of $53,369, down from an average gain of $54,000 in Q4 2017 but still up from an average gain of $45,000 in Q1 2017. The average home seller gain of $53,369 in Q1 2018 represented an average 29.5 percent return as a percentage of original purchase price, down from a 29.8 percent return in the previous quarter but still up from a 25.7 percent return in Q1 2017.
Among 154 metropolitan statistical areas analyzed in the report, those with the highest average home seller returns in Q1 2018 were San Jose, California (109.1 percent); San Francisco, California (73.6 percent); Seattle, Washington (66.0 percent); Kahului-Wailuku-Lahaina, Hawaii (65.3 percent); and Vallejo-Fairfield, California (58.8 percent).
High-end share of home sales increases from year ago to highest level in a decade
The report also included an analysis of high-end home sales trends in the wake of tax reform legislation passed in December that caps the mortgage interest deduction for federal income taxes at interest paid on $750,000 and caps the state and local tax deduction (including property taxes) at $10,000.
Nationwide homes selling for more than $1 million accounted for 4.18 percent of all U.S. single family home and condo sales in Q1 2018, up from 4.02 percent of all sales in Q4 2017 and up from 3.38 percent of all sales in Q1 2017 to the highest level since Q4 2007.
But the impact was varied depending on market. In San Jose, California, the nation’s highest-priced metro area with a median sales price of $1,150,000 in Q1 2018, the share of homes selling above $1 million increased from 39.37 percent in Q1 2017 to 58.95 percent in Q1 2018. In Westchester County, New York, which had the highest average property tax among 1,414 counties analyzed by ATTOM Data Solutions, the share of home selling above $1 million decreased from 17.68 percent in Q1 2017 to 15.05 percent in Q1 2018.
The analysis also looked at median price per square foot for homes that sold below and above $1 million. The median price per square foot of single family homes and condos that sold in the first quarter for under $1 million increased 10 percent from a year ago while the median price per square foot of homes that sold above $1 million increased 6 percent.
The price-per-square foot trends also varied by market. In Westchester County, New York, the median price per square foot for homes that sold above $1 million increased 2 percent compared to a year ago while the median price per square foot for homes that sold below $1 million increased 11 percent. In Santa Clara County in the San Jose metro area, the median price per square foot for homes that sold above $1 million increased 17 percent from a year ago while the median price per square foot for homes that sold below $1 million increased 16 percent.
Other high-level findings
- Sales to buyers using FHA loans (typically first-time homebuyers) accounted for 11.9 percent of all single family home and condo sales in Q1 2018, down from 12.6 percent in the previous quarter and down from 14.4 percent in Q1 2017 to the lowest level since Q1 2014 — a four-year low.
- Distressed home sales — including bank-owned (REO) sales, third-party foreclosure auction sales, and short sales — accounted for 14.7 percent of all single family home and condo sales in Q1 2018, up from 13.6 percent in Q4 2017 but still down from 16.9 percent in Q1 2017.
- All-cash purchases represented 30.0 percent of all single family home and condo sales in Q1 2018, up from 28.7 percent in Q4 2017 but down from 31.5 percent in Q1 2017.
- Sales to institutional investors (entities purchasing at least 10 properties in a calendar year) accounted for 1.7 percent of all single family home and condo sales in Q1 2018, down from 3.6 percent in Q4 2017 and down from 2.0 percent in Q1 2017 to the lowest level as far back as data is available, Q1 2000.
Report methodology
The ATTOM Data Solutions U.S. Home Sales Report provides percentages of distressed sales and all sales that are sold to investors, institutional investors and cash buyers, a state and metropolitan statistical area. Data is also available at the county and zip code level upon request. The data is derived from recorded sales deeds, foreclosure filings and loan data. Statistics for previous quarters are revised when each new report is issued as more deed data becomes available for those previous months. Median sales price is calculated based on the sales price on the publicly recorded sales deed when available. If no sales price is recorded then the purchase loan amount is used to calculate median price, and if no purchase loan amount is available, the property’s Automated Valuation Model (AVM) at time of sale is used to calculate the median price.
Definitions
All-cash purchases: sales where no loan is recorded at the time of sale and where ATTOM has coverage of loan data.
Institutional investor purchases: residential property sales to non-lending entities that purchased at least 10 properties in a calendar year.
REO sale: a sale of a property that occurs while the property is actively bank owned (REO).
Third-party foreclosure auction sale: a sale of a property that occurs at the public foreclosure auction (trustee’s sale or sheriff’s sale) in which the property is sold to a third-party buyer and does not transfer back to the foreclosing bank.
Short sale: a sale of a property where the sale price is less than (short) the combined amount of loans secured by the property.
Data Licensing and Custom Report Order
Investors, businesses and government institutions can contact ATTOM Data Solutions to purchase the full dataset behind the Year-End U.S. Foreclosure Market Report, including data at the state, metro, county and zip code level. The data is also available via bulk license or in customized reports. For more information contact our Data Solutions Department at 800.462.5193 or datasales@attomdata.com.
About ATTOM Data Solutions
ATTOM Data Solutions provides premium property data to power products that improve transparency, innovation, efficiency and disruption in a data-driven economy. ATTOM multi-sources property tax, deed, mortgage, foreclosure, environmental risk, natural hazard, and neighborhood data for more than 155 million U.S. residential and commercial properties covering 99 percent of the nation’s population. A rigorous data management process involving more than 20 steps validates, standardizes and enhances the data collected by ATTOM, assigning each property record with a persistent, unique ID — the ATTOM ID. The 9TB ATTOM Data Warehouse fuels innovation in many industries including mortgage, real estate, insurance, marketing, government and more through flexible data delivery solutions that include bulk file licenses, APIs and customized reports.
Media Contact:
Christine Stricker
949.748.8428
christine.stricker@attomdata.com
Data and Report Licensing:
949.502.8313
datareports@attomdata.com
Like this:
Like Loading...