Ever since the first iPad was released in 2010, people have been trying to figure out what tablets are best at. Are they entertainment devices, perfect for watching video content or playing games when traveling or curled up on the sofa? Or are they productivity tools, ideal to be creative, scribble notes or get some work done on the train? Or are they a little bit of everything? A jack of all trades, master of none? One could certainly argue that the industry itself is still trying to find the true calling of tablets, as Apple and its competitors are dabbling with keyboards and other accessories, trying to bridge the gap between smartphones and laptops.
And that may be the biggest problem faced by tablet makers. With smartphones getting larger and more powerful and laptops significantly lighter than a decade ago, it’s unclear to many people why they would need a tablet, making it a device that many consider non-essential. According to Statista Consumer Insights, tablet use is roughly half as widespread as smartphone use in most surveyed markets, with smartphone used by virtually all respondents and tablets by around half of respondents in most countries.
All jobs have risk built into them to some extent. While some are more obvious than others, for example moving heavy machinery, even sitting at a desk for long periods of time can lead to back pain, and in the longer term, appears to increase risk of death from cardiovascular disease and cancer.
The following chart uses data from a Statista Consumer Insights survey to see how reported health differs among people who mostly work from home versus from an office or factory. It found that six in ten U.S. adults who primarily work from home had experienced some kind of pain – be it back pain, joint pain or a headache – in the 12 months prior to participating in the survey. These symptoms occurred marginally more frequently for those working from home than those working from an office environment (59 percent versus 54 percent). A slightly higher share of people in the WFH group also reported having experienced digestive issues, albeit by a small difference (37 percent versus 34 percent). The three groups were fairly evenly split in terms of reported cold symptoms.
The survey also asked about workers’ mental health in the past year, finding that those who worked from home were slightly more likely to report health problems than both the other groups. With this data alone, it is not possible to say, however, whether that is a result of factors such as increased strain from longer working hours, family stress and social isolation, or whether someone experiencing mental health problems may be less likely to choose to go into an office, for example. This data reflects only whether these respondents have experienced the following issues and does not provide insight on why that is.
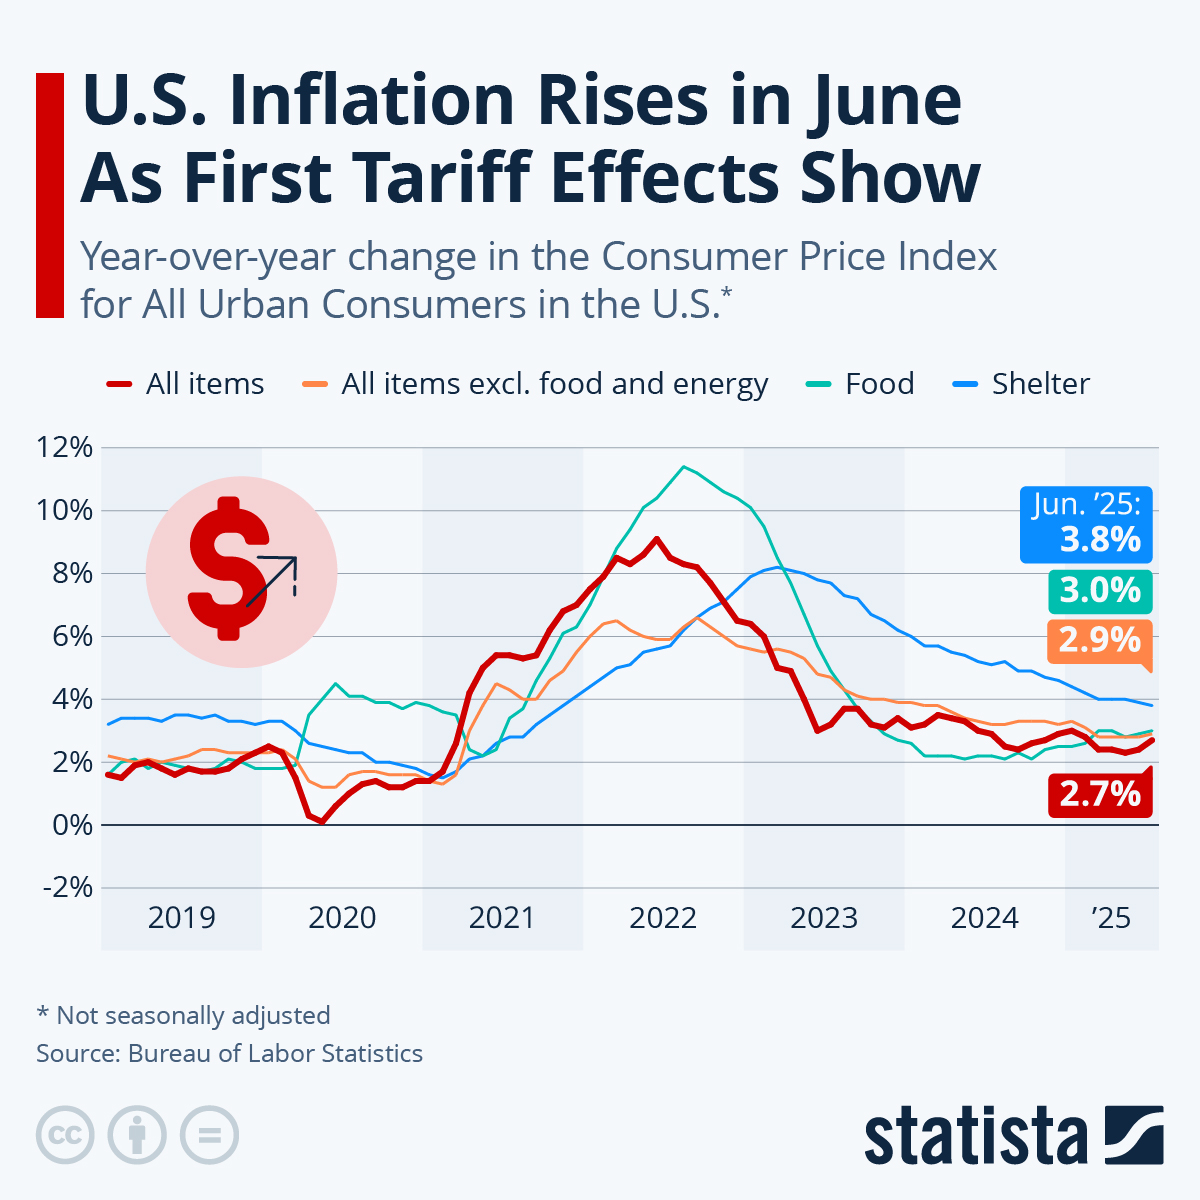
Inflation in the U.S. moderated slightly in April, despite high housing costs and gas prices continuing to put upward pressure on the Consumer Price Index. According to the Bureau of Labor Statistics, the Consumer Price Index for All Urban Consumers (CPI-U) increased 3.4 percent over the last 12 months before seasonal adjustment – down from 3.5 percent in March but still the second highest reading since September 2023. On a monthly basis, prices edged up 0.3 percent with the indexes for shelter and gasoline alone accounting for more than 70 percent of the overall increase. Meanwhile core inflation, which excludes volatile food and energy prices, came in at 3.6 percent in April with the cost of shelter accounting for more than two thirds of the year-over-year increase in the core index.
Due to its weight in the Consumer Price Index, the cost of shelter continues to be a major driver of inflation. Rents and owners’ equivalent rents of residences increased 5.4 and 5.8 percent year-over-year in April, respectively, as the index for shelter climbed for the 48th consecutive month. In fact, excluding the impact of shelter, inflation would have fluctuated around the Fed’s target level of 2 percent for the past year already, illustrating that housing costs have been the most stubborn driver of elevated inflation lately.
Back in the spring of 2021, when inflation took off, the high readings could largely be explained by the so-called base effect, as prices had fallen sharply at the onset of the pandemic a year earlier, when demand for many goods and services had suddenly dried up. Due to that initial dip in consumer prices, year-over-year comparisons were exaggerated for a while, but towards the end of 2021 inflation became a real concern, which turned into a global crisis when Russia attacked Ukraine, resulting in surging food and energy prices. Now that the conflict in Ukraine has dragged on for more than two years, price levels are measured against already elevated prices, partially explaining the steep drop in inflation in the first half of 2023 and why progress has been notably slower since then.
The latest CPI reading has reignited hopes of the Fed starting to cut rates this year. According to the CME FedWatch Tool, markets are currently pricing in a 53-percent probability of a first rate cut in September. The FOMC has kept the Federal Funds Rate steady at 5.25 to 5.50 percent since July 2023, putting the breaks on what has been the most aggressive tightening cycle since the early 1980s.