
Washington, D.C. – June 27, 2018 (nar.realtor) Pending home sales decreased modestly in May and have now fallen on an annualized basis for the fifth straight month, according to the National Association of Realtors®. A larger decline in contract activity in the South offset gains in the Northeast, Midwest and West.
![]()
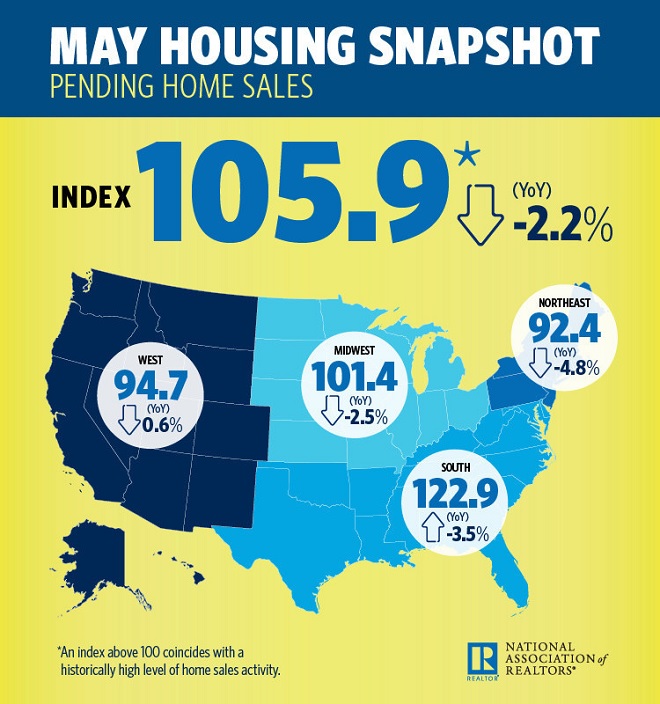
The Pending Home Sales Index,* www.nar.realtor/pending-home-sales, a forward-looking indicator based on contract signings, decreased 0.5 percent to 105.9 in May from 106.4 in April.
Lawrence Yun, NAR chief economist, says this year’s spring buying season will go down as one of unmet expectations. “Pending home sales underperformed once again in May, declining for the second straight month and coming in at the second lowest level over the past year,” he said. “Realtors® in most of the country continue to describe their markets as highly competitive and fast moving, but without enough new and existing inventory for sale, activity has essentially stalled.”
The lackluster spring, according to Yun, has primarily been a supply issue, and not one of weakening demand. If the recent slowdown in activity were because buyer interest is waning, price growth would start slowing, inventory would begin rising and homes would stay on the market longer. Instead, the underlying closing data in May showed that home price gains are still outpacing income growth, inventory declined on an annual basis for the 36th consecutive month, and listings typically went under contract in just over three weeks(1).
“With the cost of buying a home getting more expensive, it’s clear the summer months will be a true test for the housing market. One encouraging sign has been the increase in new home construction to a 10-year high,” added Yun. “Several would-be buyers this spring were kept out of the market because of supply and affordability constraints. The healthy economy and job market should keep many of them actively looking to buy, and any rise in inventory would certainly help them find a home.”
Yun now forecasts for existing-home sales in 2018 to decrease 0.4 percent to 5.49 million – down from 5.51 million in 2017. The national median existing-home price is expected to increase around 5.0 percent. In 2017, existing sales increased 1.1 percent and prices rose 5.7 percent.
The PHSI in the Northeast increased 2.0 percent to 92.4 in May, but is still 4.8 percent below a year ago. In the Midwest the index rose 2.9 percent to 101.4 in May, but is still 2.5 percent lower than May 2017.
Pending home sales in the South declined 3.5 percent to an index of 122.9 in May (unchanged from a year ago). The index in the West inched forward 0.6 percent in May to 94.7, but is 4.1 percent below a year ago.
The National Association of Realtors® is America’s largest trade association, representing 1.3 million members involved in all aspects of the residential and commercial real estate industries.
# # #
1. According to NAR’s May Realtors® Confidence Index, properties typically stayed on the market for 26 days in May.
* The Pending Home Sales Index is a leading indicator for the housing sector, based on pending sales of existing homes. A sale is listed as pending when the contract has been signed but the transaction has not closed, though the sale usually is finalized within one or two months of signing.
The index is based on a large national sample, typically representing about 20 percent of transactions for existing-home sales. In developing the model for the index, it was demonstrated that the level of monthly sales-contract activity parallels the level of closed existing-home sales in the following two months.
An index of 100 is equal to the average level of contract activity during 2001, which was the first year to be examined. By coincidence, the volume of existing-home sales in 2001 fell within the range of 5.0 to 5.5 million, which is considered normal for the current U.S. population.
NOTE: NAR’s June Housing Minute video will be released on June 29, Existing-Home Sales for June will be reported July 23, and the next Pending Home Sales Index will be July 30; all release times are 10:00 a.m. ET.
Media Contact:
Jane Dollinger
202-383-1042
Email
