
Northeast Region posts largest year-over-year increase; West, Midwest regions decline slightly
Chicago, IL – March 21, 2018 (PRNewswire) Home showings on the national level posted a 3.7 percent year-over-year increase in February, according to the ShowingTime Showing Index®, as high consumer demand continued throughout the winter and ahead of the spring season, real estate’s most important time of year for booking sales.
![]()
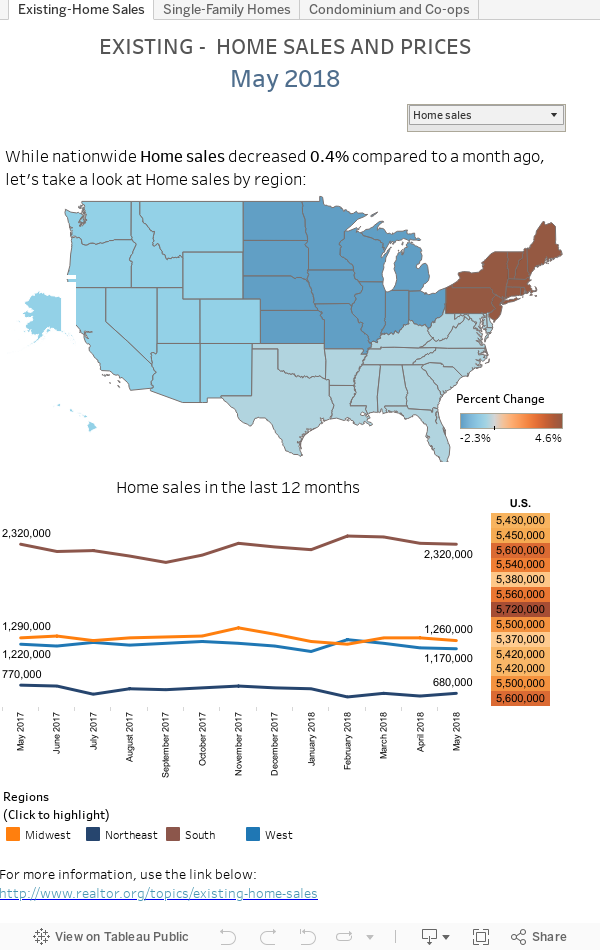
Buyer engagement via showings in the Northeast and South regions outpaced the national numbers, with the Northeast Region exhibiting an 8.4 percent year-over-year increase and the South Region experiencing a year-over-year increase of 5.3 percent.
Showing activity in the West and Midwest regions experienced slight declines in showing activity in February, with the West Region dropping 4.4 percent and the Midwest Region declining 0.4 percent compared to the previous year. Those declines can be attributed to a very busy February 2017, ShowingTime Chief Analytics Officer Daniil Cherkasskiy said.
Other issues that bear monitoring in the coming months are whether higher mortgage rates and new tax laws will impact buyers, and if the new steel and aluminum tariffs will influence the already low inventory of new homes.
“Buyer demand remains strong throughout the U.S. despite prices continuing to rise across the country,” Cherkasskiy said. “We experienced a very substantial increase in buyer activity during the last spring season, and this year seems to be just as busy throughout all of the regions. Activity in the Northeast has especially increased as we head into the spring season.”
The ShowingTime Showing Index is compiled using data from property showings scheduled across the country on listings using ShowingTime products and services. It tracks the average number of appointments received on an active listing during the month.
ShowingTime is the leading market stats and showing management technology provider to the residential real estate industry. Its MarketStats division provides interactive tools and easy-to-read market reports for MLSs, associations, brokers, agents and other real estate companies, along with recruiting software that enables brokers to identify top agents. Its showing products and services take the inefficiencies out of the appointment scheduling process. ShowingTime products are used in more than 180 MLSs and associations representing more than 900,000 real estate professionals across the U.S. and Canada. Visit www.showingtime.com.
– Median rent across the country rose 2.8 percent over the past year, the fastest pace of appreciation since May 2016, according to Zillow’s February Real Estate Market Report
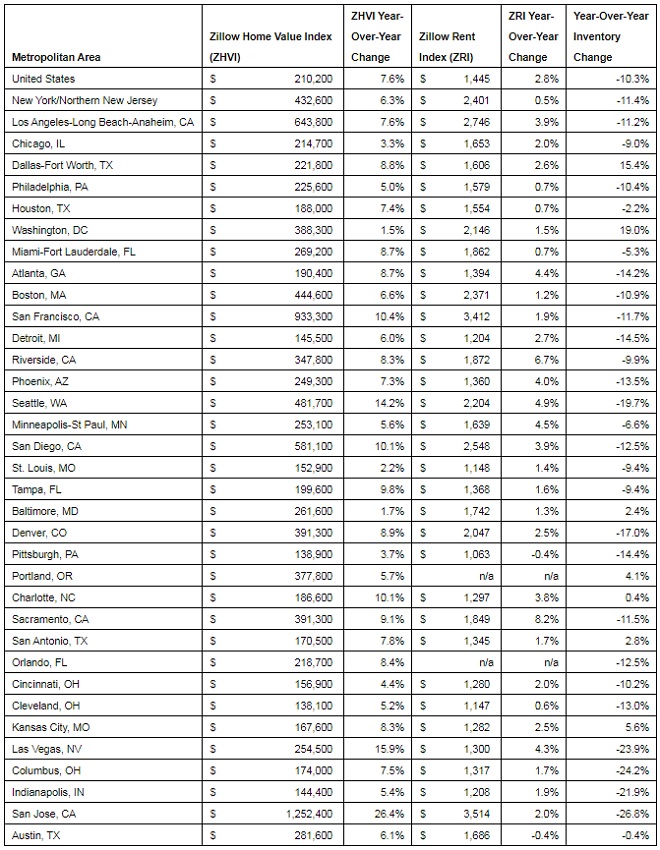
– U.S. median rent rose 2.8 percent over the past year, to $1,445. This is the fastest pace of rental appreciation since May 2016.
– Rent is rising the fastest in Sacramento, Calif., Riverside, Calif., Seattle and Minneapolis.
– Home values across the U.S. rose 7.6 percent since last February, to a median of $210,200. San Jose, Calif., Las Vegas and Seattle reported the greatest home value growth over the past year.
– Going into home shopping season, buyers will have 10 percent fewer homes to choose from than a year ago.
– Mortgage rates at the end of February were the highest since April 3, 2014.
Seattle, WA – March 22, 2018 (PRNewswire) Median rent across the nation is accelerating at its fastest pace in 21 months, according to the February Zillow® Real Estate Market Report(i). Over the past year, the median rent in the U.S. rose 2.8 percent to a Zillow Rent Index(ii) (ZRI) of $1,445.
![]()
The fastest appreciating rental markets are along the West Coast in Sacramento, Calif., Riverside, Calif., and Seattle. This is the seventh month in a row that Sacramento has topped the list of markets with the fastest rental growth. Median rent in Sacramento rose more than 8 percent since last February to a ZRI of $1,849.
Minneapolis and Atlanta also are among the fastest-appreciating rental markets, both reporting about a 4.5 appreciation rate over the past year.
As for-sale inventory remains tight, home prices rise and higher mortgage rates erode affordability, more households may opt to rent rather than buy — either by necessity or by choice — driving up demand for rental homes.
“Rental appreciation slowed between 2015 and mid-2017, but is once again picking up steam, reaccelerating over the past nine months,” said Zillow senior economist Aaron Terrazas. “For-sale inventory is tight, and with home prices continuing their rapid climb, it’s becoming more and more difficult for renters to become owners, forcing them to rent longer than they otherwise would have. Searching for the ‘right’ home has become a drawn out affair and rising prices require more savings for a down payment. Were it not for strong new apartment construction over the past half-decade, rental appreciation would be even stronger than it is now.”
Over the past nine months, national home value growth has fluctuated in the range of 7.2 percent to 7.6 percent annually. For the year ending in February 2018, home values rose 7.6 percent to a median of $210,200.
San Jose, Calif., Las Vegas and Seattle reported the greatest home value growth over the past year. In San Jose, home values rose more than 26 percent since last February to a median of $1,252,400. In Las Vegas, the median home value rose almost 16 percent; in Seattle, the median home value rose 14 percent.
Going into home shopping season, buyers will have 10 percent fewer homes to choose from than a year ago, with San Jose, Columbus, Ohio and Las Vegas reporting the greatest drop in inventory. In San Jose, there are almost 27 percent fewer homes on the market than last year, and 24 percent fewer in Columbus and Las Vegas.
The end of February saw mortgage rates at their highest since April 3, 2014. Mortgage rates(iii) on Zillow increased throughout February, starting at 4.06 percent, the lowest rate of the month, and ending at 4.26 percent. The high was hit mid-month(iv), at 4.28 percent. Zillow’s real-time mortgage rates are based on thousands of custom mortgage quotes submitted daily to anonymous borrowers on the Zillow Mortgages site and reflect the most recent changes in the market.
Zillow
Zillow is the leading real estate and rental marketplace dedicated to empowering consumers with data, inspiration and knowledge around the place they call home, and connecting them with the best local professionals who can help. In addition, Zillow operates an industry-leading economics and analytics bureau led by Zillow’s Chief Economist Dr. Svenja Gudell. Dr. Gudell and her team of economists and data analysts produce extensive housing data and research covering more than 450 markets at Zillow Real Estate Research. Zillow also sponsors the quarterly Zillow Home Price Expectations Survey, which asks more than 100 leading economists, real estate experts and investment and market strategists to predict the path of the Zillow Home Value Index over the next five years. Launched in 2006, Zillow is owned and operated by Zillow Group, Inc. (NASDAQ: Z and ZG), and headquartered in Seattle.
Zillow is a registered trademark of Zillow, Inc.
i. The Zillow Real Estate Market Reports are a monthly overview of the national and local real estate markets. The reports are compiled by Zillow Real Estate Research. For more information, visit www.zillow.com/research/. The data in Zillow’s Real Estate Market Reports are aggregated from public sources by a number of data providers for 928 metropolitan and micropolitan areas dating back to 1996. Mortgage and home loan data are typically recorded in each county and publicly available through a county recorder’s office. All current monthly data at the national, state, metro, city, ZIP code and neighborhood level can be accessed at www.zillow.com/local-info/ and www.zillow.com/research/data.
ii. The Zillow Rent Index (ZRI) is the median Rent Zestimate® (estimated monthly rental price) for a given geographic area on a given day, and includes the value of all single-family residences, condominiums, cooperatives and apartments in Zillow’s database, regardless of whether they are currently listed for rent. It is expressed in dollars.
iii. Mortgage rates for a 30-year fixed mortgage.
iv. Month high hit on February 15th.