Mortgage Denial Rates Fall, but Racial Gap Persists: Black Applicants Twice as Likely as Whites to be Denied a Conventional Loan

Suburban applicants are more likely to be approved for a conventional loan than borrowers in urban or rural areas

Seattle, WA – April 19, 2018 (PRNewswire) Mortgage applications are denied at the lowest rate in the past 20 years, yet a stark divide remains between potential homebuyers of different racial groups.

Zillow Logo

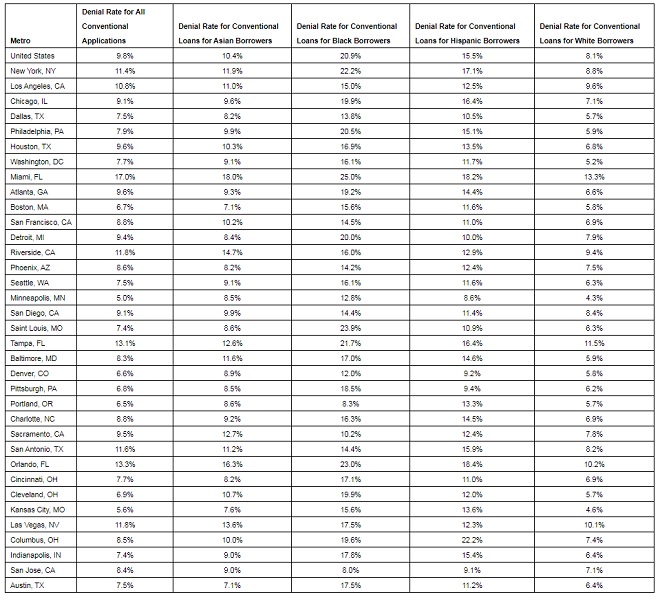
Nationally, the share of applicants who are denied for conventional mortgages has fallen to 9.8 percent, according to data from the Home Mortgage Disclosure Act (HMDA), down from 18.1 percent in 2007.

Even though a smaller share of loan applicants overall are denied, white or Asian borrowers are more likely to be approved for a mortgage than black or Hispanic borrowers. In 2016, 8.1 percent of white applicants were denied for a conventional loan, as were 10.4 percent of Asian applicants. By comparison, 20.9 percent of black borrowers and 15.5 percent of Hispanic borrowers were turned down for a loan.

For all groups, denial rates are down sharply from 2007. In 2007, 34.3 percent of black applicants and 30 percent of Hispanic applicants were denied for mortgages. White and Asian borrowers were denied 12.7 percent and 16.2 percent of the time, respectively.

The persistent disparity among races also is evident in homeownership. The gap between black and white homeownership rates was slightly wider in 2016 than it was in 1900i. Black homebuyers had the least purchasing power last year – they could afford 55 percent of homes for sale, while white homebuyers could buy about 78 percent of listed homesii. And while coming up with a down payment is the biggest hurdle to homeownership for all potential buyers, black Americans were more likely than those of other races to say qualifying for a mortgage was a barrieriii.

“Mortgage approval data point to both progress and stubborn inequities in the American housing market,” said Zillow® Senior Economist Aaron Terrazas. “By some measures, the gap in mortgage approval rates between whites and blacks is as narrow as it has ever been. However, black mortgage applicants are still more than twice as likely as whites to be denied, a visible legacy of historical discriminatory policies. For the large majority of home buyers, getting approved for a loan is the first step on the road to homeownership, and these continued disparities represent an ongoing barrier to housing and social equity in America.”

For all racial and ethnic groups, borrowers in suburban areas had the best chances of being approved for a mortgage – 8.4 percent of suburban homebuyers were denied for a loan, while 10 percent of urban borrowers and 11.5 percent of rural borrowers were turned down.

Chart

Zillow

Zillow is the leading real estate and rental marketplace dedicated to empowering consumers with data, inspiration and knowledge around the place they call home, and connecting them with the best local professionals who can help. In addition, Zillow operates an industry-leading economics and analytics bureau led by Zillow’s Chief Economist Dr. Svenja Gudell. Dr. Gudell and her team of economists and data analysts produce extensive housing data and research covering more than 450 markets at Zillow Real Estate Research. Zillow also sponsors the quarterly Zillow Home Price Expectations Survey, which asks more than 100 leading economists, real estate experts and investment and market strategists to predict the path of the Zillow Home Value Index over the next five years. Launched in 2006, Zillow is owned and operated by Zillow Group, Inc. (NASDAQ: Z and ZG), and headquartered in Seattle.

Zillow is a registered trademark of Zillow, Inc.

(i) https://www.zillow.com/research/homeownership-gap-widens-19384/
(ii) https://www.zillow.com/research/affordable-home-listings-by-race-19419/
(iii) Zillow Housing Aspirations Report, September 2017

NAR, realtor.com® Report Housing Supply and Affordability Are at Odds in Markets Across U.S.

Washington, D.C. – April 18, 2018 (nar.realtor) At the national level, housing affordability is down from a year ago and fewer households can afford the active inventory of homes currently for sale on the market based on their income. That is according to joint research from the National Association of Realtors® and realtor.com®, a leading online real estate destination.

NAR Logo

Using data on mortgages(1), state and metro area-level income(2) and listings on realtor.com®, the Realtors® Affordability Distribution Curve and Score(3) is designed to examine affordability conditions at different income levels for all active inventory on the market. A score of one or higher generally suggests a market where homes for sale are more affordable to households in proportion to their income distribution.

State affordability

According to March data, the states with the lowest Affordability Score(4) were Hawaii (0.52), California (0.57), Oregon (0.60), and the District of Columbia, Montana and Rhode Island (all at 0.64). In these areas, households at the median income level can afford only 19 to 23 percent of the active housing inventory. The states with the highest Affordability Score were Ohio (1.12), Indiana (1.09), Kansas (1.09), Iowa (1.07), and West Virginia (1.05). In these areas, a typical household can afford 54 to 62 percent of the active housing inventory currently on the market.

Metro affordability

By looking at the data by metropolitan statistical area (MSA), more metro areas experienced weakening (45) affordability conditions compared to improving conditions (35) from a year ago. The markets with the lowest affordability scores include Los Angeles-Long Beach, California (0.35), San Diego-Carlsbad, California (0.37), San Jose-Sunnyvale, California (0.43), Oxnard-Thousand Oaks-Ventura, California (0.45) and San Francisco-Oakland, California (0.48), where a typical household can only afford 3 to 11 percent of the active housing inventory.

The Youngstown-Warren, Ohio-Pennsylvania market had the highest Affordability Score at 1.25, followed by Dayton, Ohio (1.19), Toledo, Ohio (1.18), Akron, Ohio (1.16), and Scranton-Wilkes-Barre, Pennsylvania (1.11). In these areas, the typical household can afford nearly 75 percent of the homes that are currently on the market.

Lawrence Yun, NAR chief economist found a notable imbalance between what potential home buyers can afford and what is listed for sale. “The survey confirms that the lack of entry-level supply is putting affordability pressures on too many buyers – especially those at the lower end of the market, where demand is the strongest. This is why first-time buyers continue to struggle finding affordable properties to buy and are making up less than a third of home sales so far this year,” said Yun.
The Affordability Score decreased nationally from 0.86 to 0.84 between March 2017 and March 2018, because of rising prices across the country and a spike in mortgage rates. However, 14 states had better affordability compared to a year earlier, with the greatest increase in affordability in the District of Columbia (from 0.59 to 0.64), Vermont (from 0.81 to 0.84) Hawaii (from 0.50 to 0.52) and North Dakota (from 0.95 to 0.97). Thirty-five metro areas had better affordability compared to a year earlier, led by Austin-Round Rock, Texas (from 0.55 to 0.66), Syracuse, New York (1.04 to 1.1), North Port-Sarasota, Florida (0.60 to 0.66) and Palm Bay-Melbourne, Florida (0.71 to 0.77).

“We’ve seen affordability improve as inventory declines have begun to lessen these areas. More balanced supply and demand dynamics have kept listing price growth below the national average, providing some much needed relief for stretched home buyers in these areas,” according to Danielle Hale, chief economist for realtor.com®.

“Wages are growing, which is welcome news for prospective buyers, but prices are increasing at a faster rate, up almost 6 percent in the first two months of 2018. Solutions to improve these conditions include more homeowners selling, investors releasing their portfolio of single-family homes back onto the market and more single-family housing construction,” Yun said.

The Realtors® Affordability Distribution Curve and Score was created to be a valuable resource for Realtors® and consumers to assess the affordability of markets in different income groups.

The National Association of Realtors®, “The Voice for Real Estate,” is America’s largest trade association, representing 1.3 million members involved in all aspects of the residential and commercial real estate industries.

Realtor.com® is the trusted resource for home buyers, sellers and dreamers, offering the most comprehensive source of for-sale properties, among competing national sites, and the information, tools and professional expertise to help people move confidently through every step of their home journey. It pioneered the world of digital real estate 20 years ago, and today helps make all things home simple, efficient and enjoyable. Realtor.com® is operated by News Corp [NASDAQ: NWS, NWSA] [ASX: NWS, NWSLV] subsidiary Move, Inc. under a perpetual license from the National Association of REALTORS®. For more information, visit realtor.com®.

# # #

1. Down payment percentages are determined from recently locked mortgages from Optimal Blue to determine the maximum affordable home price. The maximum affordable home price assumes that 30 percent of a purchaser’s income can go to pay for the financing, property tax, homeowner’s insurance costs, and a mortgage insurance premium if the down payment is less than 20 percent. Assumptions are made that homes are financed with a 30-year fixed-rate fully-amortizing mortgage at the prevailing mortgage rate. Mortgage rates are those advertised on realtor.com® during the period analyzed.

2. Income distribution data is collected from Nielsen. Nielsen data is provided as numbers of households within income brackets, which are then calculated to find the percentile within, above, or below any bracket. See detailed methodology here: http://www.tetrad.com/pub/documents/popfactsmeth (link is external).

3. The Affordability Distribution Curve gathers income data for households in our desired market and constructs a maximum affordable house price for the income level using a down payment percentage determined from recently originated mortgages from Optimal Blue. Once a maximum affordable house price for a given income percentile is determined, active listings on realtor.com® are reviewed to see what percent of homes on the market are priced less than that maximum affordable house price.

4. The Affordability Score is two times the area under the Affordability Distribution Curve. The score varies between zero and two. A score of zero will result when no household can afford any of the homes that are currently on the market. A score of two will result when all households can afford all of the homes that are currently on the market. A score of one generally suggests a market close to equality, in other words, homes on the market are affordable to households in proportion to their income distribution.