Home Values Growing Fastest in Markets with Strictest Land-Use Regulations

Despite similar job growth, markets with the most restrictive land-use regulations saw much steeper home-value appreciation than those with lighter regulations

Seattle, WA – Aug. 2, 2018 (PRNewswire) As the economy has recovered, both the job market and home values have seen strong growth. But in places where residential land use has the strictest regulations, and which often struggle to accommodate new housing, strong job growth is associated with a much larger increase in home values.

Zillow Logo

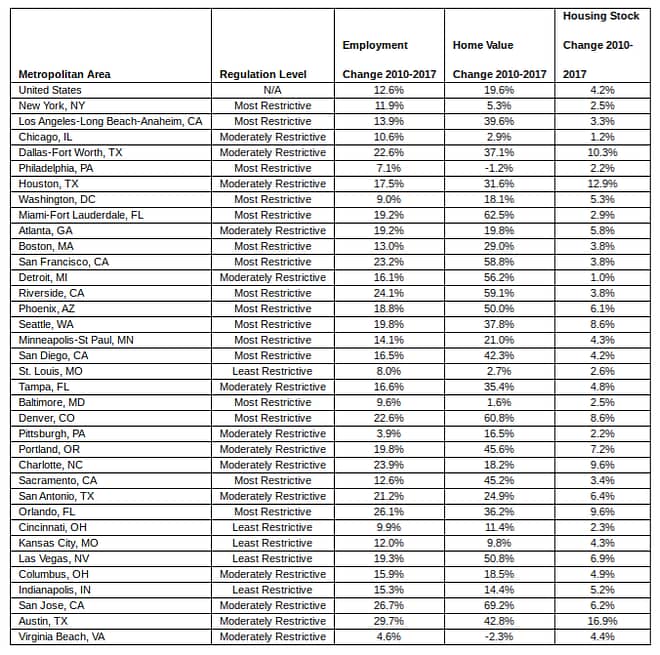
Using the Wharton Residential Land Use Regulation Index[i], Zillow® compared job growth[ii] and home value appreciation since 2010, grouping markets by how strict their regulations are. Job growth overall is correlated with home value growth, but how much home values grew in a given market depended in part on the regulations builders face when adding new homes, including density laws and permit review times.

Between 2010 and 2017, home values across the country increased by 14 percentage-points for every 10 percentage-point increase in jobs. In markets with the most restrictive regulations, home values grew 25 percentage-points for every 10 percentage-point increase in employment over that same time period.

In San Francisco, where strict regulations are combined with physical land limitations, home values rose 58.8 percent between 2010 and 2017 as employment grew 23.2 percent during those years. Similarly, Miami home values grew 62.5 percent as jobs grew 19.2 percent.

Home value appreciation was smaller in areas with less-strict regulations. Job growth in Dallas, a moderately restrictive market, was similar to that in San Francisco, but home value growth was milder, increasing 37.1 percent.

“As the housing market has recovered from the Great Recession and collapse in home values, a new challenge emerged that is driving market dynamics – the shortage of homes for potential buyers,” said Zillow Senior Economist Aaron Terrazas. “We’ve seen inventory falling on an annual basis for more than three years now. As a result of job and population growth, housing demand has overwhelmed the inventory of pre-existing homes and builders are facing a number of challenges in adding new supply, including regulatory costs. In hot job markets with some of the strictest laws about building new residential housing, home values experience the most pressure. It’s helped home values recover and exceed their previous highs, but leaves many home shoppers unable to break into the market.”

Growing job markets add to the demand for housing, and the number of homes[iii] increased as employment grew, regardless of how strict the regulations are. However, markets with the most restrictive laws added less housing than places with easier building laws. Between 2010 and 2017, markets with the tightest building regulations increased their housing stock by 4.4 percent, while markets with the loosest restrictions added 4.6 percent more homes.

Screenshot 2018-08-05 at 7.46.32 AM

Zillow

Zillow is the leading real estate and rental marketplace dedicated to empowering consumers with data, inspiration and knowledge around the place they call home, and connecting them with great real estate professionals. In addition, Zillow operates an industry-leading economics and analytics bureau led by Zillow Group’s Chief Economist Dr. Svenja Gudell. Dr. Gudell and her team of economists and data analysts produce extensive housing data and research covering more than 450 markets at Zillow Real Estate Research. Zillow also sponsors the quarterly Zillow Home Price Expectations Survey, which asks more than 100 leading economists, real estate experts and investment and market strategists to predict the path of the Zillow Home Value Index over the next five years. Launched in 2006, Zillow is owned and operated by Zillow Group, Inc. (NASDAQ:Z and ZG), and headquartered in Seattle.

Zillow is a registered trademark of Zillow, Inc.

[i] The most comprehensive nationwide effort to summarize regulatory conditions is the Wharton Residential Land Use Regulation Index, which compiles the results of a survey sent to city planners across the country in 2007. This analysis used the index to categorize all the metropolitan areas with survey responses into three groups: those with the most restrictive, moderately restrictive, and least restrictive regulations.

[ii] Jobs data comes from the Bureau of Labor Statistics

[iii] Housing stock data comes from the U.S. Census Bureau

Pending Home Sales Reverse Course, Rise 0.9 Percent in June

Washington, D.C. – July 30, 2018 (nar.realtor) Pending home sales increased in all four major regions in June, but overall activity lagged year ago levels for the sixth straight month, according to the National Association of Realtors®.

NAR Logo

The Pending Home Sales Index,* www.nar.realtor/pending-home-sales, a forward-looking indicator based on contract signings, rose 0.9 percent to 106.9 in June from 105.9 in May. Despite last month’s increase, contract signings are still down 2.5 percent on an annual basis.

Lawrence Yun, NAR chief economist, says an uptick in existing inventory helped lift contract signings in June. “After two straight months of pending sales declines, home shoppers in a majority of markets had a little more success finding a home to buy last month,” he said. “The positive forces of faster economic growth and steady hiring are being met by the negative forces of higher home prices and mortgage rates. Even with slightly more homeowners putting their home on the market, inventory is still subpar and not meeting demand. As a result, affordability constraints are pricing out some would-be buyers and keeping overall sales activity below last year’s pace.”

According to Yun, the good news is that it is possible the worst of the supply crunch affecting most of the country has passed. Last month, existing inventory was up on an annual basis – albeit slightly – for the first time in three years(1). Furthermore, pointing to realtor.com® data on year-over-year changes in inventory in June, several large metro areas saw big jumps in active listings, including Portland, Oregon (24 percent), Providence, Rhode Island (20 percent), Seattle (19 percent), Nashville, Tennessee (17 percent) and San Jose, California (15 percent).

“Home price growth remains swift and listings are still going under contract at a robust pace in most of the country, which indicates that even with rising inventory in many markets, demand still significantly outpaces what’s available for sale,” added Yun. “However, if this trend of increasing supply continues in the months ahead, prospective buyers will hopefully begin to see more choices and softer price growth.”

Heading into the second half of the year, Yun now forecasts for existing-home sales in 2018 to decrease 1.0 percent to 5.46 million – down from 5.51 million in 2017. The national median existing-home price is expected to increase around 5.0 percent. In 2017, existing sales increased 1.1 percent and prices rose 5.7 percent.

The PHSI in the Northeast increased 1.4 percent to 93.7 in June, but is still 4.1 percent below a year ago. In the Midwest the index rose 0.5 percent to 101.9 in June, but is still 2.1 percent lower than June 2017.

Pending home sales in the South climbed 1.1 percent to an index of 124.2 in June, but are 0.3 percent below a year ago. The index in the West inched forward 0.7 percent in June to 95.4, but is 5.6 percent below a year ago.

The National Association of Realtors® is America’s largest trade association, representing 1.3 million members involved in all aspects of the residential and commercial real estate industries.

# # #

1. Total housing inventory at the end of June climbed 4.3 percent to 1.95 million existing homes available for sale, up 0.5 percent from a year ago (1.94 million) and the first year-over-year increase since June 2015.

* The Pending Home Sales Index is a leading indicator for the housing sector, based on pending sales of existing homes. A sale is listed as pending when the contract has been signed but the transaction has not closed, though the sale usually is finalized within one or two months of signing.

The index is based on a large national sample, typically representing about 20 percent of transactions for existing-home sales. In developing the model for the index, it was demonstrated that the level of monthly sales-contract activity parallels the level of closed existing-home sales in the following two months.

An index of 100 is equal to the average level of contract activity during 2001, which was the first year to be examined. By coincidence, the volume of existing-home sales in 2001 fell within the range of 5.0 to 5.5 million, which is considered normal for the current U.S. population.