Looking for the top tips on how to thrive in today’s real estate market?
In today’s Real Estate Podcast, from the National Association REALTORS, REALTOR® Mabél Guzmán gives her best financial advice for buying a home in 2024 before REALTOR® Dale Mattison shares what you need to know if you’re planning on selling your home this year.
Plus, REALTOR® and investing expert Bill Brown shares how to get started in real estate investing. Then, Vice President at HSH Keith Gumbinger discusses the best path to getting a home loan. Finally, Melissa Dittmann Tracey weighs in on if cold plunge tubs are hot or not.
The gap between Black and white homeownership rates closed over the pandemic, but disparities remain
Nearly 1 in 4 Black mortgage applicants are denied, versus 1 in 10 white applicants.
Credit history is the most common reason given for denying a Black applicant.
If the typical home was worth $1, Black-owned homes would be worth 85 cents and white-owned homes worth $1.03.
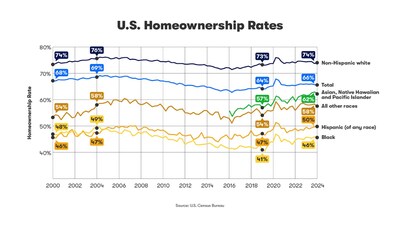
Seattle, WA – May 29, 2024 (PRNewswire) The homeownership rate for Black households has grown faster than average since 2019, but it’s still below the high-water mark reached in 2004, before the Great Recession.
Insufficient credit is holding many Black households back from homeownership. Nearly 1 in 4 mortgage applications from Black borrowers — 24% — are denied, according to 2023 Home Mortgage Disclosure Act data, which can be explored on this interactive Zillow® dashboard on housing inequality.
That’s almost twice the rate of all applicants (12.6%) and far higher than the 1-in-10 denial rate for white applicants1. Of those mortgages denied Black applicants, more than 43% are turned down due to credit history – the most common reason given. That’s a higher rate than in past years and also when compared to 32% of denials for white applicants.
“While discriminatory policies like redlining have long been outlawed, the damage from these historic practices is still felt today. Many communities once barred from accessing credit are now finance deserts, with few traditional financial institutions, making it harder to build credit and buy a house,” said Zillow senior economist Orphe Divounguy. “That’s why it’s so important to expand credit access. Allowing rent payments to count in credit scores is one example of how to move the industry forward.”
Today, nearly 46% of Black households own their home, an improvement from a low point of 43% in 2019, but still down from a 49.7% peak ownership rate reached in 2004, before the Great Recession, and far off from the 74% rate for white households. Many Black households have been left out of major wealth gains during that time. Since the Black homeownership rate peaked in 2004, U.S. home values have more than doubled, rising 117%.
Although the gap between white homeownership rates and those of Black and Hispanic households has diminished since 2019, the deficit is still large and contributes to vast inequalities in wealth.
The single largest asset for most homeowners is their house, and it’s a major means of building wealth and passing it on to the next generation. Zillow Research found a $3 trillion wealth gap between Black and white families. Nearly 40% of the gap — $1.18 trillion — could be credited to disparities in home values and ownership.
Despite rising faster than average since 2019, Black-owned home values are still far lower than average. If the typical home was worth $1, Black-owned homes would be worth 85 cents and white-owned homes worth $1.03.
How Zillow leverages technology to understand and address housing inequality and accessibility challenges.
Rent payments made to landlords on the Zillow Rentals platform can now count toward a renter’s credit score. Zillow is pushing for systemic, national changes on this front, advocating for bipartisan legislation that would encourage property owners and utility and telecom providers to report payment data to credit reporting agencies. This would give consumers who pay their bills on time the chance to build a positive credit history.
Home shoppers can see what down payment assistance programs they could qualify for on every Zillow listing, saving shoppers the hassle of looking up their eligibility on various government websites.
Continuing its investment in new technology to address biases and inequalities in housing, Zillow recently released the open-source Fair Housing Classifier. This free and easy-to-access new tool establishes guardrails to help prevent historic biases from resurfacing in real estate conversations powered by large language model (LLM) technology.
1 For conventional purchases of a primary residence.
About Zillow Group Zillow Group, Inc. (Nasdaq: Z and ZG) is reimagining real estate to make home a reality for more and more people. As the most visited real estate website in the United States, Zillow and its affiliates help people find and get the home they want by connecting them with digital solutions, dedicated partners and agents, and easier buying, selling, financing and renting experiences.
Zillow Group’s affiliates, subsidiaries and brands include Zillow®, Zillow Premier Agent®, Zillow Home Loans℠, Trulia®, Out East®, StreetEasy®, HotPads®, ShowingTime+℠, Spruce® and Follow Up Boss®.
Existing-home sales faded 1.9% in April to a seasonally adjusted annual rate of 4.14 million. Sales also dipped 1.9% from one year ago.
The median existing-home sales price grew 5.7% from April 2023 to $407,600 – the tenth consecutive month of year-over-year price gains and the highest price ever for the month of April.
The inventory of unsold existing homes climbed 9% from one month ago to 1.21 million at the end of April, or the equivalent of 3.5 months’ supply at the current monthly sales pace.
Washington, D.C. – May 22, 2024 (nar.realtor) Existing-home sales receded in April, according to the National Association of REALTORS®. All four major U.S. regions posted month-over-month declines. Year-over-year, sales decreased in the Northeast, Midwest and South but increased in the West.
Total existing-home sales1 – completed transactions that include single-family homes, townhomes, condominiums and co-ops – slid 1.9% from March to a seasonally adjusted annual rate of 4.14 million in April. Year-over-year, sales fell 1.9% (down from 4.22 million in April 2023).
“Home sales changed little overall, but the upper-end market is experiencing a sizable gain due to more supply coming onto the market,” said NAR Chief Economist Lawrence Yun.
Total housing inventory2 registered at the end of April was 1.21 million units, up 9% from March and 16.3% from one year ago (1.04 million). Unsold inventory sits at a 3.5-month supply at the current sales pace, up from 3.2 months in March and 3.0 months in April 2023. For homes priced $1 million or more, inventory and sales increased by 34% and 40%, respectively, from a year ago.
The median existing-home price3 for all housing types in April was $407,600, an increase of 5.7% from the previous year ($385,800). All four U.S. regions registered price gains.
“Home prices reaching a record high for the month of April is very good news for homeowners,” Yun added. “However, the pace of price increases should taper off since more housing inventory is becoming available.”
REALTORS® Confidence Index
According to the monthly REALTORS® Confidence Index, properties typically remained on the market for 26 days in April, down from 33 days in March but up from 22 days in April 2023.
First-time buyers were responsible for 33% of sales in April, up from 32% in March and 29% in April 2023. NAR’s 2023 Profile of Home Buyers and Sellers – released in November 20234 – found that the annual share of first-time buyers was 32%.
All-cash sales accounted for 28% of transactions in April, identical to March and one year ago.
Individual investors or second-home buyers, who make up many cash sales, purchased 16% of homes in April, up from 15% in March but down from 17% in April 2023.
Distressed sales5 – foreclosures and short sales – represented 2% of sales in April, virtually unchanged from last month and the prior year.
Single-family home sales decreased to a seasonally adjusted annual rate of 3.74 million in April, down 2.1% from 3.82 million in March and 1.3% from the prior year. The median existing single-family home price was $412,100 in April, up 5.6% from April 2023.
At a seasonally adjusted annual rate of 400,000 units in April, existing condominium and co-op sales were unchanged from last month and down 7% from one year ago (430,000 units). The median existing condo price was $365,300 in April, up 5.4% from the previous year ($346,700).
Regional Breakdown
Existing-home sales in the Northeast waned 4% from March to an annual rate of 480,000 in April, a decline of 4% from April 2023. The median price in the Northeast was $458,500, up 8.5% from the previous year.
In the Midwest, existing-home sales slipped 1% from one month ago to an annual rate of 1 million in April, down 1% from one year ago. The median price in the Midwest was $303,600, up 6% from April 2023.
Existing-home sales in the South descended 1.6% from March to an annual rate of 1.9 million in April, down 3.1% from the prior year. The median price in the South was $366,200, up 3.7% from last year.
In the West, existing-home sales retracted 2.6% from a month ago to an annual rate of 760,000 in April, an increase of 1.3% from one year before. The median price in the West was $629,600, up 9.3% from April 2023.
About the National Association of REALTORS®
The National Association of REALTORS® is America’s largest trade association, representing 1.5 million members involved in all aspects of the residential and commercial real estate industries. The term REALTOR® is a registered collective membership mark that identifies a real estate professional who is a member of the National Association of REALTORS® and subscribes to its strict Code of Ethics.
# # #
For local information, please contact the local association of REALTORS® for data from local multiple listing services (MLS). Local MLS data is the most accurate source of sales and price information in specific areas, although there may be differences in reporting methodology.NOTE: NAR’s Pending Home Sales Index for April is scheduled for release on May 30, and Existing-Home Sales for May will be released on June 21. Release times are 10 a.m. Eastern.
1 Existing-home sales, which include single-family, townhomes, condominiums and co-ops, are based on transaction closings from Multiple Listing Services. Changes in sales trends outside of MLSs are not captured in the monthly series. NAR benchmarks home sales periodically using other sources to assess overall home sales trends, including sales not reported by MLSs.
Existing-home sales, based on closings, differ from the U.S. Census Bureau’s series on new single-family home sales, which are based on contracts or the acceptance of a deposit. Because of these differences, it is not uncommon for each series to move in different directions in the same month. In addition, existing-home sales, which account for more than 90% of total home sales, are based on a much larger data sample – about 40% of multiple listing service data each month – and typically are not subject to large prior-month revisions.
The annual rate for a particular month represents what the total number of actual sales for a year would be if the relative pace for that month were maintained for 12 consecutive months. Seasonally adjusted annual rates are used in reporting monthly data to factor out seasonal variations in resale activity. For example, home sales volume is normally higher in the summer than in the winter, primarily because of differences in the weather and family buying patterns. However, seasonal factors cannot compensate for abnormal weather patterns.
Single-family data collection began monthly in 1968, while condo data collection began quarterly in 1981; the series were combined in 1999 when monthly collection of condo data began. Prior to this period, single-family homes accounted for more than nine out of 10 purchases. Historic comparisons for total home sales prior to 1999 are based on monthly single-family sales, combined with the corresponding quarterly sales rate for condos.
2 Total inventory and month’s supply data are available back through 1999, while single-family inventory and month’s supply are available back to 1982 (prior to 1999, single-family sales accounted for more than 90% of transactions and condos were measured only on a quarterly basis).
3 The median price is where half sold for more and half sold for less; medians are more typical of market conditions than average prices, which are skewed higher by a relatively small share of upper-end transactions. The only valid comparisons for median prices are with the same period a year earlier due to seasonality in buying patterns. Month-to-month comparisons do not compensate for seasonal changes, especially for the timing of family buying patterns. Changes in the composition of sales can distort median price data. Year-ago median and mean prices sometimes are revised in an automated process if additional data is received.
The national median condo/co-op price often is higher than the median single-family home price because condos are concentrated in higher-cost housing markets. However, in a given area, single-family homes typically sell for more than condos as seen in NAR’s quarterly metro area price reports.
4 Survey results represent owner-occupants and differ from separately reported monthly findings from NAR’s REALTORS® Confidence Index, which include all types of buyers. The annual study only represents primary residence purchases, and does not include investor and vacation home buyers. Results include both new and existing homes.
5 Distressed sales (foreclosures and short sales), days on market, first-time buyers, all-cash transactions and investors are from a monthly survey for the NAR’s REALTORS® Confidence Index, posted at nar.realtor.