The top ten Android apps in the U.S. last month had a combined download figure of 19 million. According to Priori Data, at the top of the list was trending game Kick the Buddy with almost three million downloads in June.
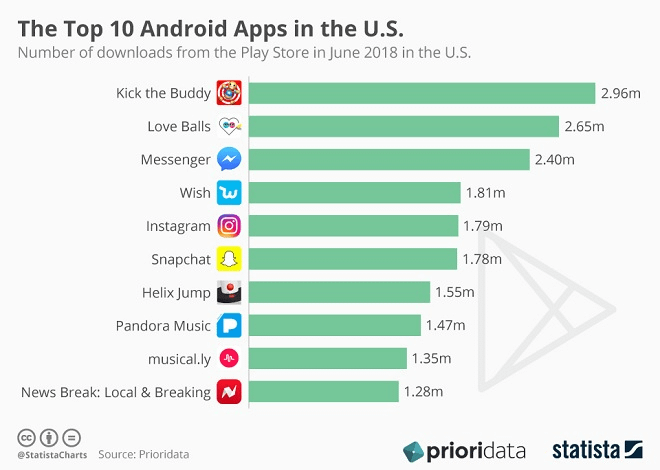

The top ten Android apps in the U.S. last month had a combined download figure of 19 million. According to Priori Data, at the top of the list was trending game Kick the Buddy with almost three million downloads in June.
Foreclosure Starts Decrease Nationwide, But Increase in 40 Percent of Local Markets; Average Days to Foreclose Drops to Lowest Level Since Q3 2016
Irvine, CA – Calif., July 12, 2018 (PRNewswire) ATTOM Data Solutions, curator of the nation’s premier property database, today released its Midyear 2018 U.S. Foreclosure Market Report, which shows a total of 362,275 U.S. properties with foreclosure filings — default notices, scheduled auctions or bank repossessions — in the first six months of 2018, down 15 percent from the same period a year ago and down 78 percent from a peak of 1,654,634 in the first six months of 2010.
![]()
Counter to the national trend, 26 of the 219 metropolitan statistical areas analyzed in the report (12 percent) posted a year-over-year increase in foreclosure activity in the first six months of 2018, including Houston, Texas (up 10 percent); Dallas-Fort Worth, Texas (up 11 percent); Cleveland, Ohio (up 4 percent); Phoenix, Arizona (up 5 percent); and Indianapolis (up 2 percent).
“Localized foreclosure flare-ups in the first half of 2018 can no longer be blamed on legacy distress left over from the last housing bubble given that nearly half of all active foreclosures are now tied to loans originated in 2009 or later and given that the average time to foreclose plummeted in the first two quarters of the year,” said Daren Blomquist, senior vice president with ATTOM Data Solutions. “Instead these local foreclosure increases are typically the result of more recent distress triggers in those markets.
“We’re also seeing early evidence of gradually loosening lending standards starting in 2014, specifically for FHA-backed loans,” Blomquist added. “The foreclosure rate on FHA loans originated in 2014 and 2015 has now jumped above the average FHA foreclosure rate for all loan vintages — the only two post-recession vintages with foreclosure rates above that overall average.”
New Jersey, Delaware, Maryland post highest state foreclosure rates
Nationwide 0.27 percent of all housing units (one in every 370) had a foreclosure filing in the first six months of 2018.
States with the highest foreclosure rates in the first half of 2018 were New Jersey (0.80 percent); Delaware (0.57 percent); Maryland (0.50 percent); Illinois (0.44 percent); and Connecticut (0.40 percent).
Other states with first-half 2018 foreclosure rates among the 10 highest nationwide were South Carolina (0.39 percent); Ohio (0.37 percent); Nevada (0.37 percent); Florida (0.37 percent); and New Mexico (0.35 percent).
Atlantic City, Trenton, Flint, with highest metro foreclosure rates
Among 219 metropolitan statistical areas analyzed in the report, those with the highest foreclosure rates in the first half of 2018 were Atlantic City, New Jersey (1.48 percent of all housing units with a foreclosure filing); Trenton, New Jersey (0.96 percent); Flint, Michigan (0.95 percent); Philadelphia, Pennsylvania (0.64 percent); and Columbia, South Carolina (0.58 percent).
Other metro areas with foreclosure rates ranking among the top 10 highest in the first half of 2018 were Cleveland, Ohio (0.58 percent); Albuquerque, New Mexico (0.55 percent); Rockford, Illinois (0.53 percent); Peoria, Illinois (0.52 percent); and Baltimore, Maryland (0.52 percent).
First-half foreclosure starts down nationwide, up in 40 percent of local markets
A total of 191,914 U.S. properties started the foreclosure process in the first six months of 2018, down 8 percent from the first half of 2017 and down 82 percent from a peak of 1,074,471 in the first half of 2009.
Counter to the national trend, 22 states posted a year-over-year increase in foreclosure starts in the first half of 2018, including Texas (up 11 percent); Michigan (up 5 percent); Arizona (up 1 percent); Indiana (up 51 percent); and Tennessee (up 13 percent).
Also counter to the national trend, 88 of the 219 metro areas analyzed in the report (40 percent) posted year-over-year increases in foreclosure starts in the first half of 2018, including Houston, Texas (up 25 percent); Dallas-Fort Worth, Texas (up 17 percent); Las Vegas, Nevada (up 7 percent); Detroit, Michigan (up 23 percent); and Minneapolis-St. Paul, Minnesota (up 50 percent).
First-half bank repossessions down in all but one state
A total of 133,290 U.S. properties were repossessed by lenders through foreclosure (REO) in the first half of 2018, down 21 percent from the first half of 2017 and down 75 percent from a peak of 529,633 in the first half of 2010.
All but one state (New Mexico) posted a year-over-year decrease in REOs in the first half of 2018.
Q2 2018 foreclosure activity below pre-recession levels in 55 percent of markets
A total of 188,843 U.S. properties had a foreclosure filing in Q2 2018, down 1 percent from the previous quarter and down 14 percent from a year ago. The second quarter of 2018 was the seventh consecutive quarter in which U.S. foreclosure activity was below the pre-recession average of 278,912 properties with foreclosure filings per quarter in 2006 and 2007.
Foreclosure activity in the second quarter of 2018 was below pre-recession averages in 121 of the 219 metropolitan statistical areas analyzed in the report (55 percent), including Los Angeles, California (56 percent below); Chicago, Illinois (25 percent below); Dallas-Fort Worth, Texas (75 percent below); Houston, Texas (37 percent below); and Miami, Florida (55 percent below).
Counter to the national trend, 98 of the 219 metropolitan statistical areas analyzed in the report (45 percent) posted Q2 2018 foreclosure activity totals above their pre-recession averages, including New York-Newark-Jersey City (50 percent above); Philadelphia, Pennsylvania (42 percent above); Washington, D.C. (51 percent above); Boston, Massachusetts (19 percent above); and Baltimore, Maryland (235 percent above).
Average foreclosure timeline decreases for second straight quarter
Properties foreclosed in the second quarter of 2018 took an average of 720 days from the first public foreclosure notice to complete the foreclosure process, down from 791 days in the previous quarter and down from 883 days in the second quarter of 2017 — the second consecutive quarter with a year-over-year decrease and the shortest average foreclosure timeline since Q3 2016.
States with the longest average foreclosure timelines for foreclosures completed in Q2 2018 were Hawaii (1,553 days), Florida (1,166 days), New Jersey (1,161 days), Utah (1,108 days), and Indiana (1,054 days).
States with the shortest average foreclosure timelines for foreclosures completed in Q2 2018 were Arkansas (152 days), Virginia (169 days), New Hampshire (177 days), Mississippi (188 days), and Minnesota (222 days).
Report methodology
The ATTOM Data Solutions U.S. Foreclosure Market Report provides a count of the total number of properties with at least one foreclosure filing entered into the ATTOM Data Warehouse during the month and quarter. Some foreclosure filings entered into the database during the year may have been recorded in the previous year. Data is collected from more than 2,200 counties nationwide, and those counties account for more than 90 percent of the U.S. population. ATTOM’s report incorporates documents filed in all three phases of foreclosure: Default — Notice of Default (NOD) and Lis Pendens (LIS); Auction — Notice of Trustee Sale and Notice of Foreclosure Sale (NTS and NFS); and Real Estate Owned, or REO properties (that have been foreclosed on and repurchased by a bank). For the annual, midyear and quarterly reports, if more than one type of foreclosure document is received for a property during the timeframe, only the most recent filing is counted in the report. The annual, midyear, quarterly and monthly reports all check if the same type of document was filed against a property previously. If so, and if that previous filing occurred within the estimated foreclosure timeframe for the state where the property is located, the report does not count the property in the current year, quarter or month.
About ATTOM Data Solutions
ATTOM Data Solutions provides premium property data to power products that improve transparency, innovation, efficiency and disruption in a data-driven economy. ATTOM multi-sources property tax, deed, mortgage, foreclosure, environmental risk, natural hazard, and neighborhood data for more than 155 million U.S. residential and commercial properties covering 99 percent of the nation’s population. A rigorous data management process involving more than 20 steps validates, standardizes and enhances the data collected by ATTOM, assigning each property record with a persistent, unique ID — the ATTOM ID. The 9TB ATTOM Data Warehouse fuels innovation in many industries including mortgage, real estate, insurance, marketing, government and more through flexible data delivery solutions that include bulk file licenses, APIs, market trends, marketing lists, match & append and more.
Media Contact:
Christine Stricker
(949) 748-8428
christine.stricker@attomdata.com
Data and Report Licensing:
(949) 502-8313
datareports@attomdata.com
LendingTree’s Chief Economist analyzes June’s mortgage offers
Charlotte, NC – July 11, 2018 (PRNewswire) LendingTree®, the nation’s leading online loan marketplace, today released its monthly Mortgage Offers Report which analyzes data from actual loan terms offered to borrowers on LendingTree.com by lenders on LendingTree’s network. The purpose of the report is to empower consumers by providing additional information on how their credit profile affects their loan prospects.

Purchase APR by Credit Score Range
Purchase Mortgage Offers by Credit Score

Refinance Mortgage Offers by Credit Score

Each week LendingTree also releases its Mortgage Rate Competition Index and Mortgage Savings Tracker. The LendingTree Mortgage Rate Competition Index is a new measure of the dispersion in mortgage pricing. Built on top of the Mortgage Rate Competition Index, the Mortgage Savings Tracker brings transparency to mortgage shopping by highlighting the significant savings that are available to potential borrowers for both purchase mortgages and refinancing.
This week’s report found that homebuyers could have seen median lifetime savings of $26,690 in interest on a $300,000 loan by comparison shopping for the best mortgage rates last week. This week’s Mortgage Rate Competition Index was 0.58 for purchase mortgages, up 0.01 from the previous week.
“Our monthly report continues to illustrate the impact a credit score can have on the cost of financial products,” said Tendayi Kapfidze, LendingTree’s Chief Economist and report author. “Homebuyers’ credit scores can allow them to be more competitive in a marketplace with limited inventory and heightened competition.”
To view the original report, visit https://www.lendingtree.com/home/mortgage-offers-report-june-2018/.
About the Report
The LendingTree Mortgage Offers Report contains data from actual loan terms offered to borrowers on LendingTree.com by lenders. We believe it is an important addition to standard industry surveys and reports on mortgage rates. Most quoted industry rates are for a hypothetical borrower with prime credit who makes a 20% down payment. Most borrowers do not fit this profile. Our report includes the average quoted APR by credit score, together with the average down payment and other metrics described below. We stratify by credit score, so borrowers have added information on how their credit profile affects their loan prospects. The report covers conforming 30-yr fixed loans for both purchase and refinance.
About LendingTree
LendingTree (NASDAQ: TREE) is the nation’s leading online loan marketplace, empowering consumers as they comparison-shop across a full suite of loan and credit-based offerings. LendingTree provides an online marketplace which connects consumers with multiple lenders that compete for their business, as well as an array of online tools and information to help consumers find the best loan. Since inception, LendingTree has facilitated more than 65 million loan requests. LendingTree provides free monthly credit scores through My LendingTree and access to its network of over 500 lenders offering home loans, personal loans, credit cards, student loans, business loans, home equity loans/lines of credit, auto loans and more. LendingTree, LLC is a subsidiary of LendingTree, Inc. For more information go to www.lendingtree.com, dial 800-555-TREE, like our Facebook page and/or follow us on Twitter @LendingTree.
MEDIA CONTACT:
Megan Greuling
(704)-943-8208
Megan.greuling@lendingtree.com