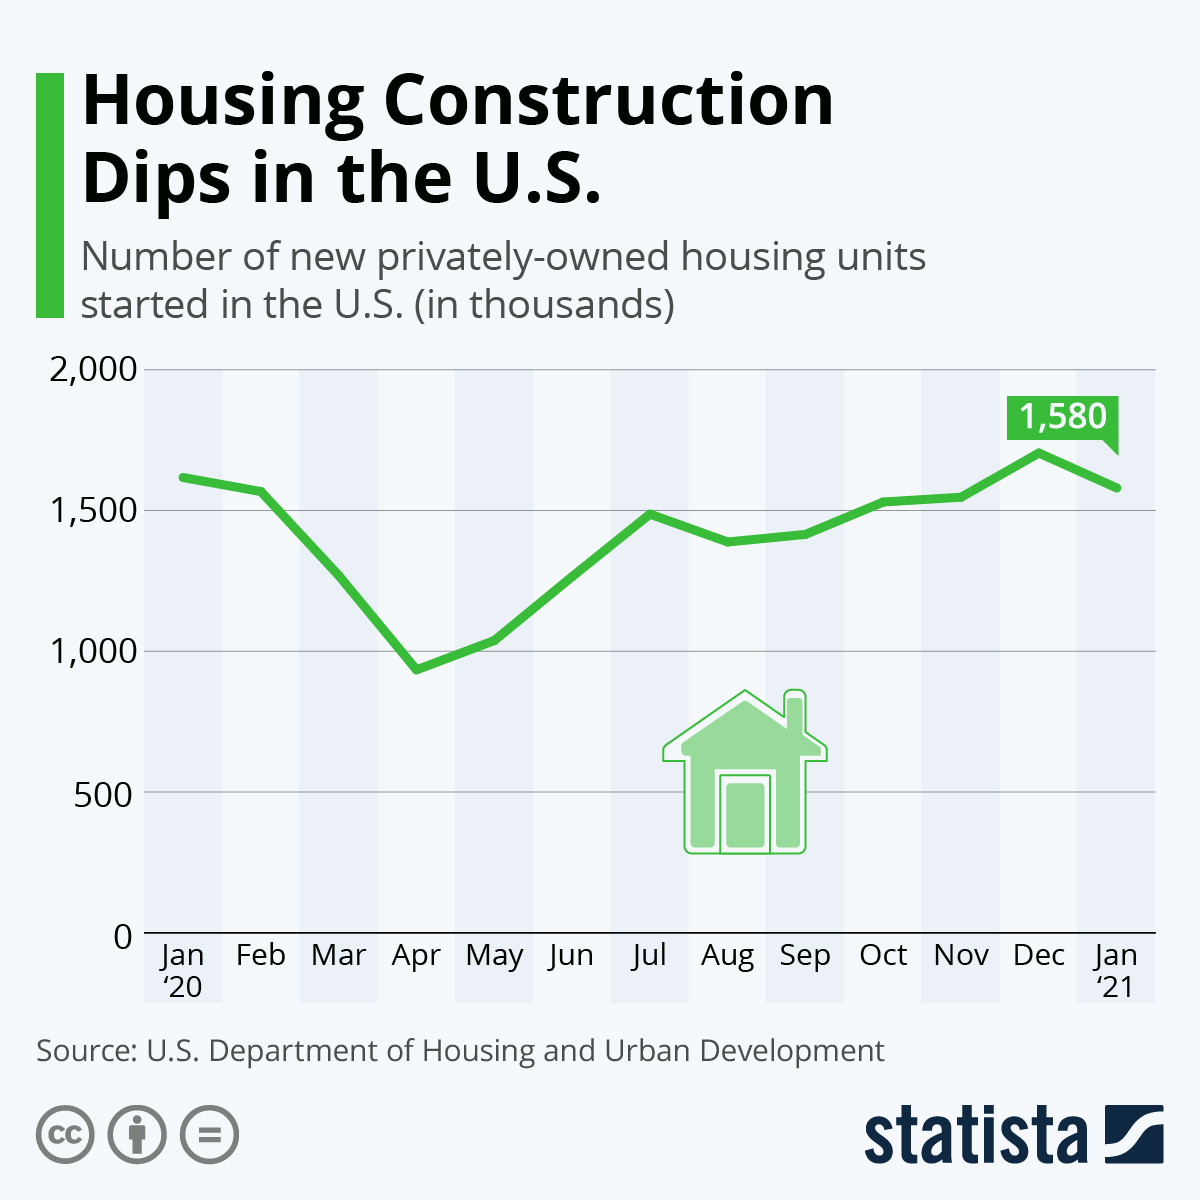
Following a surge in new housing starts to end 2019, the global COVID-19 pandemic has reached the private housing construction industry in the U.S. and caused a record-low number of new projects in the country.
In data reported from the Department of Housing and Urban Development, just 974,000 new housing constructions were started in the country for the month of May. While that’s a slight increase from May, it missed analysts expectations of a quick rebound in housing starts as construction companies get back to work.
Housing construction had been in a slump throughout 2018, and had just reached a recovery period that culminated in a healthy 1.6 million new housing starts in January to begin the year.
Analysts expect an unsurprising contraction in the housing market but are optimistic that construction and sales could resume as lockdowns for COVID-19 are lifted. Still, with unemployment skyrocketing and over 40 million Americans still out of work, the housing industry – like many other industries – could be down for some time before a proper recovery is realized.
Home Sales Down 34% Over Previous Year While Price Increases Remain
Denver, CO – June 17, 2020 (PRNewswire) May, often the second-strongest month for home sales, saw what many believe may be the biggest housing impact from the pandemic as closings dropped 33.7% compared to last year.
All 53 markets in the report sustained double-digit year-over-year sales declines:
Sales in four markets shrunk by more than half, led by Detroit’s drop of 64.8%
Eighteen markets saw sales drop by one-fourth to one-third
Des Moines’s sales decline of 14.3% was the smallest
While the Median Sales Price of $272,000 was up 4.7%, it was softer than the 5.4% average May-to-May price increase in the previous five years.
Inventory dropped 25% year-over-year to one of the lowest levels for May in the report’s 12-year history. Only Indianapolis (12.7%), Wichita (4.3%) and Chicago (1%) posted increases in the number of homes for sale compared to May 2019.
With May being the second full month under stay-at-home mandates in many states, home sales were the lowest for the month since 2012, and on a par with wintertime home-sales activity. Compare that to 2017, 2018 and 2019, when May posted the highest or second-highest home sales of the year. June typically sees the year’s most home sales and highest Median Sales Price.
“Not surprisingly, May sales were historically muted alongside increasingly pinched inventory as the full brunt of the pandemic likely manifested itself during the month,” said Adam Contos, CEO of RE/MAX Holdings, Inc. “However, as the local outlook across the country increasingly pivoted to how soon stay-at-home restrictions might end, multiple leading indicators in the U.S. housing market have turned positive, some even on a year-over-year basis.”
Contos continued, “We believe the spring selling season was largely deferred for several weeks. And, with home being the center of people’s lives this year, we could see the effect of pent-up demand play out in a significant way. Absent another major coronavirus wave, inventory levels and the unemployment rate may well be the governors on how strong the housing market performs this year.”
The average Days on Market of 46 and the 2.5 Months Supply of Inventory both tied report records for May, set in 2018.
Closed Transactions Of the 53 metro areas surveyed in May 2020, the overall average number of home sales is down 3.9% compared to April 2020, and down 33.7% compared to May 2019. All 53 metro areas saw a year-over-year decrease in closed transactions. The metro areas with the lowest year-over-year decreases were Des Moines, IA at -14.3%, Little Rock, AR at -15.5%, and Richmond, VA at -15.6%.
Median Sales Price – Median of 53 metro median prices In May 2020, the median of all 53 metro Median Sales Prices was $272,000, down 1.0% from April 2020, and up 4.7% from May 2019. Five metro areas saw a year-over-year decrease in Median Sales Price, with the largest decreases in Detroit, MI at -2.9%, Burlington, VT at -1.3%, and Houston, TX at -0.7%. Three metro areas increased year-over-year by double-digit percentages, Manchester, NH at +11.9%, New York, NY at +10.8%, and Miami, FL at +10.0%.
Days on Market – Average of 53 metro areas The average Days on Market for homes sold in May 2020 was 46, equal to the average in April 2020, and down two days from the average in May 2019. The metro areas with the lowest Days on Market were Seattle, WA at 22, Cincinnati, OH at 24, and Nashville, TN at 25. The highest Days on Market averages were in Miami, FL at 103, Des Moines, IA at 96, and Burlington, VT at 91. Days on Market is the number of days between when a home is first listed in an MLS and a sales contract is signed.
Months Supply of Inventory – Average of 53 metro areas The number of homes for sale in May 2020 was down 4.0% from April 2020 and down 25.0% from May 2019. Based on the rate of home sales in May 2020, the Months Supply of Inventory decreased to 2.5 compared to 3.7 in April 2020, and decreased compared to 3.0 in May 2019. A six months supply indicates a market balanced equally between buyers and sellers. In May 2020, of the 53 metro areas surveyed, four metro areas reported a months supply at or over six, which is typically considered a buyer’s market. Those four markets were Indianapolis, IN at 6.4, Miami, FL at 6.9, New Orleans, LA at 6.1, and New York, NY at 9.6. The markets with the lowest Months Supply of Inventory were Albuquerque, NM at 0.9, Omaha, NE at 1.0, and a three-way tie between Charlotte, NC, Manchester, NH, and Denver, CO at 1.1.
For specific data in this report or to request an interview, please contact mediarelations@remax.com
About the RE/MAX Network As one of the leading global real estate franchisors, RE/MAX, LLC is a subsidiary of RE/MAX Holdings (NYSE: RMAX) with over 130,000 agents in more than 110 countries and territories. Nobody in the world sells more real estate than RE/MAX, as measured by residential transaction sides. Dedicated to innovation and change in the real estate industry, RE/MAX launched Motto Mortgage, a ground-breaking mortgage franchisor, in 2016 and acquired booj, a real estate technology company, in 2018. RE/MAX agents have lived, worked and served in their local communities for decades, raising millions of dollars every year for Children’s Miracle Network Hospitals® and other charities. To learn more about RE/MAX, to search home listings or find an agent in your community, please visit www.remax.com. For the latest news about RE/MAX, please visit news.remax.com.
Description The RE/MAX National Housing Report is distributed each month on or about the 15th. The first Report was distributed in August 2008. The Report is based on MLS data in approximately 53 metropolitan areas, includes all residential property types, and is not annualized. For maximum representation, many of the largest metro areas in the country are represented, and an attempt is made to include at least one metro from each state. Metro area definitions include the specific counties established by the U.S. Government’s Office of Management and Budget, with some exceptions.
Definitions Transactions are the total number of closed residential transactions during the given month. Months Supply of Inventory is the total number of residential properties listed for sale at the end of the month (current inventory) divided by the number of sales contracts signed (pended) during the month. Where “pended” data is unavailable, this calculation is made using closed transactions. Days on Market is the number of days that pass from the time a property is listed until the property goes under contract for all residential properties sold during the month. Median Sales Price is the median of the median sales prices in each of the metro areas included in the survey.
MLS data is provided by contracted data aggregators, RE/MAX brokerages and regional offices. While MLS data is believed to be accurate, it cannot be guaranteed. MLS data is constantly being updated, making any analysis a snapshot at a particular time. Every month the RE/MAX National Housing Report re-calculates the previous period’s data to ensure accuracy over time. All raw data remains the intellectual property of each local MLS organization.
— Zillow’s economic research team expects a modest price drop through October
— The typical U.S. home value grew 4.3% year over year in May to $251,598. The month-over-month change slowed noticeably from April, perhaps the first signal of a modest price fall.
— Rents grew 2.2% year over year to $1,657, but were growing 3.4% annually just two months earlier.
— Despite a small increase from the previous month, inventory is down 9.6% year over year.
Seattle, WA – June 18, 2020 (PRNewswire) The housing market has shown resilience during the coronavirus pandemic, slowing as stay-at-home orders were given across the country, but not screeching to a halt. Home values had been staying the course, continuing to grow at roughly the same pace as before the outbreak. But the May Zillow® Real Estate Market Reporti may have revealed the first indication that home values will fall in the second half of the year.
According to the Zillow Home Value Index, the typical home value in the U.S. is $251,598, up 4.3% year over year — a small acceleration from April’s 4.2% year over year. But by more recent measures the growth rate has begun to slow.
In April, home values grew 0.41% month over month. In May, that slowed to 0.35%, the biggest one-month slowdown since March 2019 and a possible indicator that the market is headed for home value declines in the coming months. The most recent forecast from Zillow’s economic research team shows an expected 1.8% drop in prices through October 2020 from the highs in February, with a slow price recovery by mid-spring in 2021. The year-over-year change is forecasted to bottom out at -0.7%.
May’s home value growth slowdown was widespread, hitting 27 of the 35 largest U.S. metros. Home value growth slowed the most over April in a mix of the most expensive areas (San Francisco, San Jose, Los Angeles and Seattle), what had been the hottest markets (Phoenix, Columbus and Indianapolis) and metros in states with a relatively high number of COVID-19 cases (Detroit and Pittsburgh).
Home values outright fell from April to May in five metros — San Francisco, San Jose, Pittsburgh, Los Angeles and Sacramento.
“Home buyers returned to the market earlier than might have been expected given the state of the economy, finding a market starved for inventory because of seller uncertainty. This improved demand has supported home prices and appears to have given sellers a confidence boost as new listings have slowly picked up,” said Skylar Olsen, senior principal economist at Zillow. “The next question housing will face is whether this growth can continue after demand built up during housing’s brief pause in the pandemic’s early days runs its course. It’s likely housing will feel the broader economy’s downturn eventually, though to a mild degree, and home values will fall in the coming months.”
Annual rent growth slowed for the third consecutive month, up 2.2% year over year to $1,657 after growing 3.4% annually just two months prior. That’s the lowest rate of year-over-year growth since at least 2014. The annual growth rate slowed from the previous month in 27 large metros, and rents fell from last May in New York and San Jose.
In a positive sign for inventory, for-sale listings grew 1.5% from last month. Still, inventory is not growing at the rate typically seen during the springtime — inventory grew 4.5% from April to May 2019 — and is down 9.6% from last year as a result. Increased buyer demand is helping to keep inventory low — newly pending sales were up 28.5% month over month as of the first week of June, and page views on for-sale homes on Zillow were 41% higher than a year ago at the end of Mayii. It’s likely buyer demand will soften in the coming months as the wave of pre-existing demand from before the pandemic dries up, especially if unemployment remains high.
Mortgage rates listed by third-party lenders on Zillow started the month at 3.52% and rose to a peak of 3.59% on May 11. Rates reached their monthly low on May 21 at 3.42%, and ended the month at 3.49%. Zillow’s real-time mortgage rates are based on thousands of custom mortgage quotes submitted daily to anonymous borrowers on the Zillow Group Mortgages site by third-party lenders and reflect recent changes in the marketiii.
Metropolitan Area
Zillow Home Value Index (ZHVI), May 2020
ZHVI – MoM Change, May 2020
ZHVI – MoM Change, April 2020
ZHVI – YoY Change, May 2020
Typical Rent, May 2020
Typical Rent – YOY Change, May 2020
Total Inventory – YOY Change, May 2020
United States
$251,598
0.35%
0.41%
4.3%
$1,657
2.2%
-9.6%
New York, NY
$489,137
0.13%
0.14%
1.2%
$2,675
-0.3%
-15.9%
Los Angeles, CA
$695,412
-0.05%
0.39%
4.8%
$2,502
1.6%
-25.5%
Chicago, IL
$243,752
0.00%
0.04%
0.8%
$1,756
0.9%
-10.9%
Dallas-Fort Worth, TX
$257,309
0.33%
0.36%
2.8%
$1,547
1.6%
-1.7%
Philadelphia, PA
$255,816
0.33%
0.33%
3.3%
$1,592
2.3%
-27.4%
Houston, TX
$221,426
0.31%
0.40%
3.0%
$1,468
0.5%
1.4%
Washington, DC
$442,151
0.33%
0.35%
3.3%
$2,046
0.6%
-16.5%
Miami-Fort Lauderdale, FL
$308,358
0.39%
0.45%
3.4%
$1,954
2.0%
-11.0%
Atlanta, GA
$245,983
0.37%
0.42%
4.7%
$1,520
2.2%
1.0%
Boston, MA
$504,318
0.38%
0.41%
3.7%
$2,690
1.5%
-20.5%
San Francisco, CA
$1,120,498
-0.77%
-0.32%
1.6%
$3,121
0.6%
-22.0%
Detroit, MI
$187,529
0.09%
0.45%
4.7%
$1,167
2.6%
-10.3%
Riverside, CA
$392,071
0.25%
0.38%
3.7%
$1,923
4.4%
-21.3%
Phoenix, AZ
$300,740
0.95%
1.11%
9.3%
$1,463
6.0%
-21.1%
Seattle, WA
$543,523
0.44%
0.75%
7.1%
$1,963
3.2%
-24.4%
Minneapolis-St. Paul, MN
$301,440
0.36%
0.47%
4.8%
$1,567
1.8%
1.3%
San Diego, CA
$633,752
0.51%
0.42%
5.6%
$2,325
2.3%
-23.7%
St. Louis, MO
$183,000
0.26%
0.33%
2.8%
$1,084
3.4%
-11.2%
Tampa, FL
$235,572
0.54%
0.65%
5.7%
$1,527
3.5%
-11.2%
Baltimore, MD
$297,468
0.14%
0.11%
1.3%
$1,590
0.2%
-20.2%
Denver, CO
$448,001
0.43%
0.32%
3.3%
$1,729
0.8%
-10.5%
Pittsburgh, PA
$162,803
-0.07%
0.27%
4.1%
$1,170
3.1%
-17.8%
Portland, OR
$426,019
0.48%
0.38%
3.4%
$1,603
1.3%
-10.1%
Charlotte, NC
$244,059
0.68%
0.72%
6.5%
$1,446
2.0%
-8.2%
Sacramento, CA
$441,845
-0.01%
0.29%
4.9%
$1,789
3.4%
-10.3%
San Antonio, TX
$208,916
0.12%
0.06%
2.8%
$1,291
2.0%
5.7%
Orlando, FL
$263,183
0.60%
0.65%
5.1%
$1,571
1.2%
-9.0%
Cincinnati, OH
$191,623
0.71%
0.57%
5.5%
$1,175
4.8%
-16.6%
Cleveland, OH
$163,400
0.40%
0.50%
5.1%
$1,060
3.6%
-20.5%
Kansas City, MO
$209,994
0.56%
0.56%
4.8%
$1,126
3.6%
-16.9%
Las Vegas, NV
$296,575
0.24%
0.49%
2.3%
$1,414
2.2%
-19.1%
Columbus, OH
$219,012
0.33%
0.47%
6.0%
$1,251
2.9%
-10.5%
Indianapolis, IN
$187,285
0.52%
0.67%
6.2%
$1,136
3.4%
-7.3%
San Jose, CA
$1,200,523
-0.32%
0.07%
3.0%
$3,086
-0.3%
-26.3%
Austin, TX
$349,169
0.71%
0.64%
4.8%
$1,561
0.8%
-1.8%
About Zillow
Zillow, the top real estate website in the U.S., is building an on-demand real estate experience. Whether selling, buying, renting or financing, customers can turn to Zillow’s businesses to find and get into their next home with speed, certainty and ease.
In addition to for-sale and rental listings, Zillow Offers buys and sells homes directly in dozens of markets across the country, allowing sellers control over their timeline. Zillow Home Loans, our affiliate lender, provides our customers with an easy option to get pre-approved and secure financing for their next home purchase.
Millions of people visit Zillow Group sites every month to start their home search, and now they can rely on Zillow to help them finish it — with the same confidence, ease and empowerment they’ve come to expect from real estate’s most trusted brand.
Launched in 2006, Zillow is owned and operated by Zillow Group, Inc. (NASDAQ:Z and ZG) and headquartered in Seattle.
Zillow and Zillow Offers are registered trademarks of Zillow, Inc.
i The Zillow Real Estate Market Reports are a monthly overview of the national and local real estate markets. The reports are compiled by Zillow Real Estate Research. For more information, visit www.zillow.com/research/. The data in Zillow’s Real Estate Market Reports are aggregated from public sources by a number of data providers for 928 metropolitan and micropolitan areas dating back to 1996. Mortgage and home loan data are typically recorded in each county and publicly available through a county recorder’s office. All current monthly data at the national, state, metro, city, ZIP code and neighborhood level can be accessed at www.zillow.com/research/data.
ii Including all page views of for-sale homes on Zillow.com and the Zillow app, excluding those from real estate agents and other professional users. Zillow measures page views with Google Analytics. Daily figures were calculated using a seven-day trailing average. Year-over-year comparisons were made after offsetting 2019 data by two days in order to compare consistent days of the week.
iii Zillow Group Marketplace, Inc. is a licensed mortgage broker, NMLS #1303160.