LendingTree Study Finds Cincinnati, Milwaukee and Minneapolis are the Best Places to Pay Down Debt

Charlotte, NC – Jan. 14, 2019 (PRNewswire) LendingTree®, the nation’s leading online loan marketplace, today released its study on the best places to pay down debt.

Lendingtree Logo

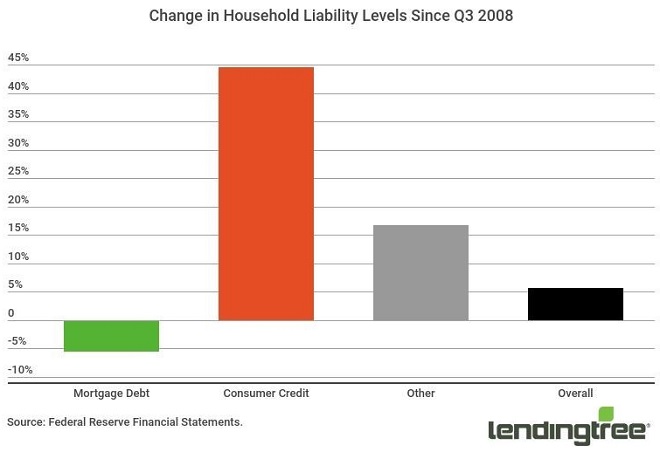
Americans’ debt balances continued climbing in 2018, with total consumer debt tracking to top $4 trillion by the end of that year. With balances climbing high, many borrowers will want to use the new year to prioritize paying off debt.

LendingTree analysts wanted to find out whether some major U.S. cities afford their residents more opportunities to pay down existing debt than others and ranked the 50 most populous U.S. metropolitan areas according to the following factors that reflect residents’ abilities to pay down debt.

  • Average credit utilization, as a percentage
  • Average monthly rent-to-income ratio, as a percentage
  • Regional prices on goods and services
  • Local unemployment rate
  • State’s scoring on debt-friendly laws and policies

Key takeaways

  • Cost of living plays a large role in determining where it’s easiest and hardest to pay down debt. All of the 10 best places to pay off debt have rent-to-income ratios below 20 percent, and all but one have below-average prices on goods and services.
  • Cincinnati tops the list of best places to pay down debt, thanks to an exceptionally low cost of living and a relatively good unemployment rate. The metro received a final score of 77.2.
  • Milwaukee and Minneapolis follow closely behind with final scores of 75.6 and 75.5, respectively.
  • Riverside, Calif., is a tougher place to pay off debt, thanks to a high cost of living and high unemployment. The metro received a final score of 31.8.
  • Residents of Detroit and Los Angeles are also challenged, with final scores of 40.8 and 42.3, respectively.

Chart

In the 10 best cities to pay down debt, locals have several factors working in their favor. All of these cities have average revolving credit balances that are at or just under a third of their limits, which is right in line with a good credit utilization ratio of 30 percent or less. With lower balances to begin with, borrowers in these cities can more easily wrangle these types of debt.

Low costs of living also work in residents’ favor. Typical rent costs in all 10 cities is less than under 20 percent of income, and Minneapolis is the only city with a goods and services price index above the national average.

Rent costs compared to local wages are lowest in Cincinnati, claiming just 15.9 percent of median gross income. The Ohio city also has the lowest prices on goods and services. Austin locals pay the highest rents relative to their incomes, at 19.9 percent.

Lastly, these 10 cities also boasted below-average unemployment rates and were more likely to have solid protections for debtors.

To view the full report, visit www.lendingtree.com.

About LendingTree

LendingTree (NASDAQ: TREE) is the nation’s leading online marketplace that connects consumers with the choices they need to be confident in their financial decisions. LendingTree empowers consumers to shop for financial services the same way they would shop for airline tickets or hotel stays, comparing multiple offers from a nationwide network of over 500 partners in one simple search, and can choose the option that best fits their financial needs. Services include mortgage loans, mortgage refinances, auto loans, personal loans, business loans, student refinances, credit cards and more. Through the My LendingTree platform, consumers receive free credit scores, credit monitoring and recommendations to improve credit health. My LendingTree proactively compares consumers’ credit accounts against offers on our network, and notifies consumers when there is an opportunity to save money. In short, LendingTree’s purpose is to help simplify financial decisions for life’s meaningful moments through choice, education and support. LendingTree, LLC is a subsidiary of LendingTree, Inc. For more information, go to www.lendingtree.com, dial 800-555-TREE, like our Facebook page and/or follow us on Twitter @LendingTree.

Media Contact:

press@lendingtree.com

Household Debt to Surpass 2008 Peak by $1 Trillion

LendingTree’s Consumer Debt Outlook finds credit card balances still below 2008 levels; student loan debt levels continue to balloon

Charlotte, NC – June 21, 2018 (PRNewswire) LendingTree®, the nation’s leading online loan marketplace, today released its Consumer Debt Outlook for June 2018, finding that American household debt is currently on pace to exceed the prior peak debt level from 2008 by the end of June, primarily due to non-mortgage consumer debt. LendingTree’s analysis of the latest Federal Reserve data found that mortgage-related household debt has actually fallen by 5.5 percent while total consumer credit – a collection of revolving credit and installment loans – has increased by 45 percent, of which 42 percent is comprised of student debt alone.

lendingtree

Analysis Highlights

  • American household debt is currently on pace to be $1 trillion above the peak debt level of 2008 by the end of this month. That figure has been increasing at a 3.4 percent annual rate and includes mortgage debt.
  • Total mortgage and consumer debt levels are on pace to reach $15.7 trillion at the end of the second quarter, versus $14.7 trillion 10 years ago.
  • Credit card debt, student loans and auto loans have increased by 45 percent over the past decade. Consumer debt (which excludes mortgages) is on pace to exceed $4 trillion by December 2018.
  • Mortgages weigh less on American households than they have in recent years, even though they comprise the largest amount of debt. As measured by a percentage of disposable income, outstanding mortgages comprise less of a liability.
  • Total student loan debt recently surpassed $1.5 trillion and comprises 42 percent of all consumer debt. That far exceeds the 27 percent share of debt credit card balances occupy. A decade ago, those percentages were reversed.
  • While nominal total debt levels now exceed 2008 levels, households are much better situated to handle debt than they were a decade ago. Mortgage balances currently are around 68 percent of disposable income, and credit card balances are less than 7 percent of income. In 2008, balances were as high as 98 percent and 10 percent, respectively.
  • One exception to the overall trend is millennials, who largely shoulder most of the growing student loan debt and are underrepresented in homeownership rates.

Household debt to surpass 2008 peak by $1 trillion

In the first quarter of this year, household net worth, as measured by the Federal Reserve Financial Accounts, reached $100 trillion for the first time. Assets — primarily financial instruments and real estate — gained more than $1.07 trillion in the first quarter, handily outpacing the additional debt Americans accumulated.

Nonetheless, liabilities have been steadily increasing in recent years. But unlike a decade ago, mortgages aren’t the culprit. It is non-mortgage-related debt, such as student loans, credit card debt and auto loans, that have been growing. By the end of the second quarter 2018, we’ll have $1 trillion more in household debt than we did in 2008 — and none of it is attributable to housing.

Since the third quarter of 2008, the peak of last decade’s housing bubble, mortgage-related household debt has actually fallen by 5.5 percent. Meanwhile, consumer credit — a collection of revolving credit and installment loans, has increased by 45 percent.

Chart

Chart 1

Credit card balances still below 2008 levels; student loan debt levels continue to balloon

Consumer credit is a collection of a number of household liabilities — auto loans, credit cards and student loans are the three largest types. Of the three, student loan balances are growing the fastest — they’ve risen 130 percent since the housing crisis began. Compare that with auto loans, which have risen a much more modest 39 percent in the past decade. Credit card balances are actually slightly lower than they were in 2008, and that’s before factoring in 10 years of inflation.

In other words, over the past decade, the burden of non-mortgage debt has shifted from credit card borrowers to student loan borrowers. Credit cards and student loans have switched places. In 2008, credit card debt comprised 40 percent of household liabilities, and student loan debt made up 27 percent. Today, those shares are swapped — student loans make up 42 percent of the nation’s household debt, and credit cards are now only 28 percent of the share.

But no matter the mix, the trend is definitely more debt. LendingTree analysts project that total consumer debt (excluding mortgage debt) will exceed $4 trillion by the end of 2018.

Income gains are mitigating the increase for most; millennials are an exception

Although total household debt has returned to 2008 levels, the difference in 2008 and today’s income and types of debt are significant.

Most important, mortgage balances as a percentage of disposable personal income has fallen from a high of 98 percent in 2008 to 68 percent as of the latest quarter. In other words, homeowners today, on average, have significant equity in their homes. Ten years ago, equity was virtually nonexistent.

Similarly, credit card debt, as measured as a percentage of income, has fallen by about 30 percent versus the levels they were at a decade earlier. Credit card balances represent about 6.6 percent of income as of the first quarter of 2018; a decade ago, it was nearly 9 percent.

At the other end of the spectrum, student loan borrowers are shouldering nearly 70 percent more than they were a decade ago, as student loans now represent 10.3 percent of disposable income, versus 6 percent a decade ago.

As millennials bear most of this student loan debt while remaining underrepresented in homeownership versus other age cohorts, the economic distress of millennials becomes much more understandable, at least on a relative basis, and relating specifically to debt burdens.

To view the full report, visit: www.lendingtree.com.

About LendingTree

LendingTree (NASDAQ: TREE) is the nation’s leading online loan marketplace, empowering consumers as they comparison-shop across a full suite of loan and credit-based offerings. LendingTree provides an online marketplace which connects consumers with multiple lenders that compete for their business, as well as an array of online tools and information to help consumers find the best loan. Since inception, LendingTree has facilitated more than 65 million loan requests. LendingTree provides free monthly credit scores through My LendingTree and access to its network of over 500 lenders offering home loans, personal loans, credit cards, student loans, business loans, home equity loans/lines of credit, auto loans and more. LendingTree, LLC is a subsidiary of LendingTree, Inc. For more information go to www.lendingtree.com, dial 800-555-TREE, like our Facebook page and/or follow us on Twitter @LendingTree.

MEDIA CONTACT:

Megan Greuling
(704) 943-8208
megan.greuling@lendingtree.com

LendingTree Releases Monthly Mortgage Offer Report for April

LendingTree’s Chief Economist analyzes April’s mortgage offers

Charlotte, NC – May 9, 2018 (PRNewswire) LendingTree®, the nation’s leading online loan marketplace, today released its monthly Mortgage Offers Report which analyzes data from actual loan terms offered to borrowers on LendingTree.com by lenders on LendingTree’s network. The purpose of the report is to empower consumers by providing additional information on how their credit profile affects their loan prospects.

lendingtree

  • April’s best offers for borrowers with excellent profiles had an average APR of 4.26% for conforming 30-year fixed purchase loans, up from 4.25% in March. Refinance loan offers were down 1 bps to 4.23%. Mortgage rates vary depending upon parameters including a borrower’s credit score, loan-to-value ratio, income and property type.
  • For the average borrower, purchase APRs for conforming 30-year fixed loans offered on LendingTree’s platform were up 7 bps to 4.92%. The loan note rate of 4.81% hit the highest since March 2016 and was up 6 bps from March 2018. We prefer to emphasize the APR as lenders often make changes to other fees in response to changing interest rates.
  • Consumers with the highest credit scores (760+) saw offered APRs of 4.78% in April, versus 5.07% for consumers with scores of 680-719. The APR spread of 29 bps between these score ranges was up 2 bps from March and the widest since this data series began in March 2016. The spread represents almost $15,000 in additional costs for borrowers with lower credit scores over 30 years for the average purchase loan amount of $234,437. The additional costs are due to higher interest rates, larger fees or a combination of the two.
  • Refinance APRs for conforming 30-year fixed loans were up 6 bps to 4.89%. The credit score bracket spread remained at 24 bps, amounting to nearly $13,000 in extra costs over the life of the loan for lower credit score borrowers given an average refinance loan of $239,199.
  • Average proposed purchase down payments were down nearly $5,000 from March at $57,946.

Chart

“We are in the core of the spring selling season for homes,” said Tendayi Kapfidze, LendingTree’s Chief Economist and report author. “Supply problems are dampening sales of existing homes and are particularly acute for lower-priced homes. Sales for homes under $100,000 were down 21% Y/Y in March, and those between $100,000 and $250,000 were down 8% Y/Y. Low inventory is the defining characteristic of the current housing market, and buyers should do all they can to position themselves competitively. We advise improving your credit score, getting financing in place ahead of the house hunt and shopping around for the best mortgage rates.”

Chart

About the Report

The LendingTree Mortgage Offers Report contains data from actual loan terms offered to borrowers on LendingTree.com by lenders. We believe it is an important addition to standard industry surveys and reports on mortgage rates. Most quoted industry rates are for a hypothetical borrower with prime credit who makes a 20% down payment. Most borrowers do not fit this profile. Our report includes the average quoted APR by credit score, together with the average down payment and other metrics described below. We stratify by credit score, so borrowers have added information on how their credit profile affects their loan prospects. The report covers conforming 30-yr fixed loans for both purchase and refinance.

  • APR: Actual APR offers to borrowers on our platform
  • Down Payment: Though analogous to the LTV, we find that borrowers identify more closely with the down payment. Academic studies have also found that the down payment is the primary concern for homebuyers and one of the main impediments to entering the homebuying market.
  • Loan Amount: The average loan amount borrowers are offered
  • LTV: Actual LTV offered to borrowers on our platform
  • Lifetime Interest Paid: This is the total cost a borrower incurs for the loan, inclusive of fees.

To view the original report, visit https://www.lendingtree.com/home/mortgage-offers-report-april-2018/.

About LendingTree:
LendingTree (NASDAQ: TREE) is the nation’s leading online loan marketplace, empowering consumers as they comparison-shop across a full suite of loan and credit-based offerings. LendingTree provides an online marketplace which connects consumers with multiple lenders that compete for their business, as well as an array of online tools and information to help consumers find the best loan. Since inception, LendingTree has facilitated more than 65 million loan requests. LendingTree provides free monthly credit scores through My LendingTree and access to its network of over 500 lenders offering home loans, personal loans, credit cards, student loans, business loans, home equity loans/lines of credit, auto loans and more. LendingTree, LLC is a subsidiary of LendingTree, Inc. For more information go to www.lendingtree.com, dial 800-555-TREE, like our Facebook page and/or follow us on Twitter @LendingTree.

Media Contact:
Megan Greuling
(704) 943-8208
Megan.greuling@lendingtree.com