The information in this infographic comes from the 2017 Home Buyer and Seller Generational Trends report.
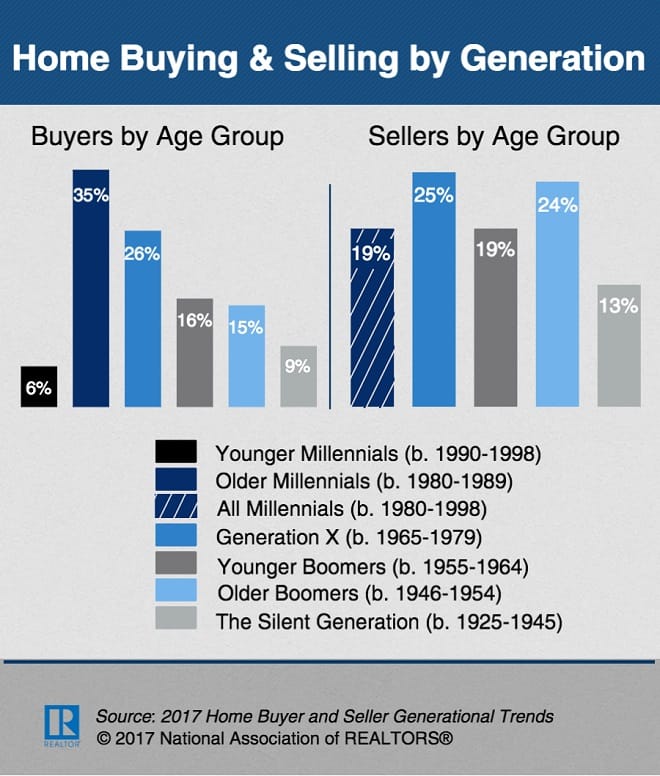

The information in this infographic comes from the 2017 Home Buyer and Seller Generational Trends report.
Source: realtor.org
This infographic is about home buying and selling by age group. The information it contains comes from the 2015 Home Buyers & Sellers Generational Trends report.
How has home buying changed since your parents’ time? NAR dug deep for this one in this article: www.realtor.com
To find out how much home buying has changed over the last 30 years, they decided to compare the home-buying and ownership experience today with back when your parents bought their first place in the ’80s. Let’s jump into the realtor.com® DeLorean and go Back to the Real Estate Future: 1985 versus 2015. Buckle up!
For more home buying data visualized, check out How Much Have Housing Prices Gone Up in 30 Years? (Hint: it’s less than a Big Mac): www.realtor.com