Buying A Home More Affordable Than Renting In 54 Percent Of U.S. Housing Markets

But 64 Percent of Population Live in Markets More Affordable to Rent Than Buy; Least Affordable Rental Markets Led by Counties in Northern California, DC, Brooklyn; Most Affordable Rental Markets in Alabama, Illinois, Ohio, Tennessee

Irvine, CA – Jan. 11, 2018 (PRNewswire) ATTOM Data Solutions, curator of the nation’s largest multi-sourced property database, today released its 2018 Rental Affordability Report, which shows that buying a median-priced home is more affordable than renting a three-bedroom property in 240 of 447 U.S. counties analyzed for the report — 54 percent.

ATTOM Logo

The analysis incorporated recently released fair market rent data for 2018 from the U.S. Department of Housing and Urban Development, wage data from the Bureau of Labor Statistics along with public record sales deed data from ATTOM Data Solutions in 447 U.S. counties with sufficient home sales data (see full methodology below).

“Although buying is still more affordable than renting in the majority of U.S. housing markets, that majority is shrinking as home price appreciation continues to outpace rental growth in most areas,” said Daren Blomquist, vice president at ATTOM Data Solutions. “Renting has clearly become the lesser of two housing affordability evils in many major population centers, with renting more affordable than buying in 76 percent of counties that have a population of 1 million or more. And when broken down by population rather than number of markets, this data shows that the majority of the U.S. population — 64 percent — live in markets that are more affordable to rent than to buy.”

Renting more affordable than buying in nation’s most populated counties
Counter to the overall trend, renting is more affordable than buying a home in the nation’s 14 most populated counties and in 30 of 39 counties with a population of 1 million or more (76 percent) — including Los Angeles County, California; Cook County (Chicago), Illinois; Harris County (Houston), Texas; Maricopa County (Phoenix), Arizona; and San Diego County, California.

Other markets with a population of more than 1 million where it is more affordable to rent than to buy a home included counties in Miami, New York City, Seattle, Las Vegas, San Jose, San Francisco and Boston.

“The thing about this data that concerns me the most is that it is now more affordable to rent in the greater Seattle area than buy. Even with solid income growth, the rapid rise in home prices is keeping many would-be buyers out of ownership,” said Matthew Gardner, chief economist with Windermere Real Estate, covering the Seattle market. “To make matters worse, rapid rental rate growth in the core King County market is forcing many renters to look farther out to find something they can afford. Seattle needs considerably more affordable housing for renters and home buyers alike. Unless something changes, the area will remain very expensive, pricing many buyers out of the market.”

Among the 39 U.S. counties analyzed in the report with a population of 1 million or more, the nine where it is more affordable to buy a home than rent included Tarrant County (Dallas), Texas; Broward County (Miami), Florida and Bexar County, (San Antonio) Texas.

Least affordable rental markets in Northern California, DC, Brooklyn
The report shows that renting a three-bedroom property requires an average of 38.8 percent of weekly wages across the 447 counties analyzed for the report.

The least affordable markets for renting were Marin County, California (79.5 percent of average wages to rent); Spotsylvania County (Washington, D.C. area), Virginia (75.5 percent) and Honolulu County, Hawaii (71.9 percent).

Most affordable rental markets in Alabama, Illinois, Ohio, Tennessee
The most affordable markets for renting were Madison County (Huntsville), Alabama (22.3 percent of average wages to rent); Tazewell County (Peoria), Illinois (23.6 percent); and Greene County (Dayton), Ohio (24.1 percent).

Rents rise faster than wages in 60 percent of markets
Average fair market rents rose faster than average weekly wages in 266 of the 447 counties analyzed in the report (60 percent), including Los Angeles County, California; Cook County, Illinois and Harris County, Texas.

Home prices rising faster than rents in 59 percent of markets
Median home prices rose faster than average fair market rents in 263 of the 447 counties analyzed in the report, including Los Angeles County, California; Cook County, Illinois and San Diego County, California.

Full Report & Methodology

About ATTOM Data Solutions
ATTOM Data Solutions is the curator of the ATTOM Data Warehouse, a multi-sourced national property database that blends property tax, deed, mortgage, foreclosure, environmental risk, natural hazard, health hazards, neighborhood characteristics and other property characteristic data for more than 150 million U.S. residential and commercial properties. The ATTOM Data Warehouse delivers actionable including bulk file licenses, APIs and customized reports.

Media:

Christine Stricker
714.873.4275
christine.stricker@attomdata.com

Data and Report Licensing:
949.502.8313
datareports@attomdata.com

San Jose and Raleigh are Zillow’s Hottest Housing Markets for 2018

Tech-towns Seattle and San Francisco also make top rankings along with several Sun Belt markets

Seattle, WA – Jan. 9, 2018 (PRNewswire) Today, Zillow® announced its predictions for 2018’s hottest housing markets. Topping the list this year is Silicon Valley’s San Jose, Calif., followed by Raleigh, N.C. and Seattle.

Zillow Logo

To identify 2018’s hottest housing markets, Zillow looked for places with quickly rising home values and rental prices, low unemployment rates, steady income growth and strong job opportunities with lots of people moving to the area.

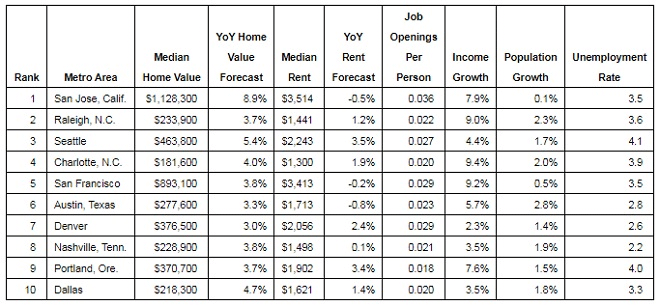
Austin, Texas has the strongest population growth on the top 10 list, at 2.8 percent. Seattle has the highest forecasted rental appreciation, with rents in the metro expected to climb another 3.5 percent over the next 12 months.

Rapid home value growth and a high number of job openings per person are the driving forces behind San Jose’s position at the top of Zillow’s list. The San Jose housing market has been booming for several years, mainly due to people moving to the area for high-paying jobs. Zillow’s analysis highlights just how strong the San Jose market really is. While San Francisco home values have recently started to cool, San Jose is off to the races, with home values projected to rise 9 percent in 2018. The median home value in San Jose is over $1 million, and the median rental price is $3,514 per month. Over the past five years, San Jose home values have appreciated 78 percent.

Although Zillow’s list is largely made up of established tech towns, two increasingly hot North Carolina markets also made the top 10 ranking. Income and population growth in Charlotte and Raleigh are among the strongest of all markets on the list. Raleigh anchors North Carolina’s “Research Triangle” and saw a 9 percent increase in income growth last year. In Charlotte, a fast-growing banking center, incomes rose about 9.5 percent over the past year.

Zillow’s Top 10 Housing Markets for 2018:

1. San Jose, CA
2. Raleigh, NC
3. Seattle, WA
4. Charlotte, NC
5. San Francisco, CA
6. Austin, TX
7. Denver, CO
8. Nashville, TN.
9. Portland, OR
10. Dallas, TX

“This list shows that just because a market is smaller or more affordable doesn’t mean it isn’t dynamic,” said Zillow senior economist Aaron Terrazas. “Growing cities in the Sun Belt, places like Raleigh, Charlotte and Nashville, offer plenty of opportunities healthcare and finance, while providing a less-expensive, but still-convenient, alternative to the larger and pricier markets in the Northeast. The tech industry continues to roar, attracting thousands of new residents per year to tech-dominant markets like Seattle, Denver and the Bay Area. The higher cost of living in these areas is offset to a large degree by well-paying tech jobs.”

In nine out of the 10 markets on Zillow’s list, home values are expected to rise at a faster pace than the nation overall, with the exception of Denver. Nationally, Zillow expects home values to appreciate 3.2 percent over the next year.

Zillow used six variables to determine the hot market predictions: Zillow’s Home Value and Rent Forecast, which forecasts the change in the Zillow Home Value Index(i) and Zillow Rent Index(ii) over the next 12 months, recent income and population growth(iii), current unemployment rates(iv), the number of job openings per person using data from Glassdoor. Those six variables were then scaled for the 50 largest U.S. metros and combined to form a ‘hotness score,’ producing the top ten list.

Chart

About Zillow
Zillow is the leading real estate and rental marketplace dedicated to empowering consumers with data, inspiration and knowledge around the place they call home, and connecting them with the best local professionals who can help. In addition, Zillow operates an industry-leading economics and analytics bureau led by Zillow’s Chief Economist Dr. Svenja Gudell. Dr. Gudell and her team of economists and data analysts produce extensive housing data and research covering more than 450 markets at Zillow Real Estate Research. Zillow also sponsors the quarterly Zillow Home Price Expectations Survey, which asks more than 100 leading economists, real estate experts and investment and market strategists to predict the path of the Zillow Home Value Index over the next five years. Zillow also sponsors the bi-annual Zillow Housing Confidence Index (ZHCI) which measures consumer confidence in local housing markets, both currently and over time. Launched in 2006, Zillow is owned and operated by Zillow Group Inc. (NASDAQ: Z and ZG), and headquartered in Seattle.

Zillow is a registered trademark of Zillow, Inc.

(i) The Zillow Home Value Index (ZHVI) is the median estimated home value for a given geographic area on a given day and includes the value of all single-family residences, condominiums and cooperatives, regardless of whether they sold within a given period. It is expressed in dollars, and seasonally adjusted.

(ii) The Zillow Rent Index (ZRI) is the median Rent Zestimate® (estimated monthly rental price) for a given geographic area on a given day, and includes the value of all single-family residences, condominiums, cooperatives and apartments in Zillow’s database, regardless of whether they are currently listed for rent. It is expressed in dollars.

(iii) Incomes in this analysis were determined using Moody’s Analytics® estimates from the Census Bureau. Population growth was determined using ACS 2015 and 2016 1-year estimates.

(iv) Unemployment rates in this analysis were determined using Moody’s Analytics® estimates from the Bureau of Labor Statistics, Local Area Unemployment Statistics.