Realtor.com® Identifies Toughest Housing Markets for Millennials

List includes San Jose, Calif.; Seattle and Salt Lake City, as well as some surprises

Santa Clara, CA – April 26, 2018 (PRNewswire) This spring, the largest generation in U.S. history – millennials – is colliding with the toughest home buying season in history, and they will fare better in some markets than others. According to a new analysis released today by realtor.com®, the home of home search, the combination of low inventory, escalating home prices and high demand have made San Jose, Seattle, Salt Lake City, Minneapolis and Omaha, Neb., the toughest areas in the country for millennial buyers this spring.

realtor.com logo

“Millennials want to buy, but record-low inventory is making it extremely difficult,” Danielle Hale, chief economist for realtor.com®. “Our analysis shows millennials are facing challenges in both established markets such as San Jose and Seattle, as well as more recently popular areas like Omaha and Salt Lake City. Despite the difficulties, first-timers are optimistic and more than willing to weather the challenges this spring has to offer.”

Key Dynamics in the Top Five Markets

All the markets on the list are millennial hotspots that have attracted 25- to 34-year-olds with strong economies and high-paying jobs. As a result, millennials make up a higher share of the population, at 14.6 percent, compared to 13.4 percent for the U.S. Household income among 25- to 34 year-olds in these five locations is also significantly higher, at roughly $79,000, compared to the U.S. median of $59,800. Additionally, based on realtor.com® search data, millennials in these markets are very interested in buying a home. In the first quarter, they accounted for 25 percent of views, higher than any other age group.

However, low inventory levels and high prices are making it tough for these would-be buyers. Nationally, inventory is 35 percent lower than the spring of 2012 and prices have reached a new high of $280,000. The shortage is even more acute in these five metros. Compared to this time last year, active listings in these five metros remain 8 percent lower, age of inventory is 7 percent lower, and list prices are 8 percent higher. Supply is nearly three times lower than the rest of the country, at 5.7 listings versus 16.1 listings per 1,000 households. Additionally, listings in these areas are scarcer and selling faster for more money. In these five metros active listings are 9 percent lower, age of inventory is 13 percent lower, and list prices are 14 percent higher from a year ago.

Toughest Housing Markets for Millennials

1. San Jose – The median list price in San Jose is $1,244,000, compared to $280,000 for the U.S. overall. On average, San Jose millennials earn $109,800 annually. Millennials make up 14.3 percent of the total population in San Jose and account for 24.1 percent of total realtor.com® page views in the area.

Millennials are flocking to San Jose in hopes of earning the “tech salary” that everyone is chasing. Apple, Adobe, Intel, and NASA are just a few of the companies that call this area home. With San Jose State University and nearby Stanford University, the area is replete with young students and scholars. The inventory shortage is especially significant in the area and is pushing non-tech industry workers to the outskirts.

2. Seattle – The median list price in Seattle is $553,000. On average, millennials earn $78,300. Millennials make up 15.4 percent of the total population in Seattle and account for 24.2 percent of total realtor.com® page views in the area.

Big tech employers such as Amazon, Microsoft, and Expedia are a big draw for millennial and non-millennial workers to the Seattle area. Beyond the tech scene, Seattle offers great outdoor spaces, such as Kerry Park and a thriving nightlife in Ballard and Capitol Hill. Despite Seattle’s already high home prices, real estate professionals don’t see any end in sight given the large amount of tech money flooding into the area. They also report many millennials are spending more than $1,000,000 on their first home due to the high salaries and home prices in the area.

3. Salt Lake City – The median list price in Salt Lake City is $394,000. On average, millennials earn $67,800 annually. Millennials make up 15.5 percent of the total population in Salt Lake City and account for 26 percent of total realtor.com® page views in the area.

Salt Lake City offers the perfect blend of city life and the great outdoors for millennial professionals. Intermountain Healthcare Medical Center, University Hospital and the University of Utah are the largest employers in the area, with other notable companies such as Delta Air Lines and eBay. Located just an hour from Park City, residents can spend the morning downtown shopping one of the city’s many trendy shopping areas, and be on the slopes by mid-afternoon. However, millennials are struggling to find their place in the hot housing market. Many homes under $350,000 are getting scooped up instantly by older buyers who often have more money.

4. Minneapolis – The median list price in Minneapolis is $283,000. On average, millennials earn $73,600 annually. Millennials make up 13.8 percent of the total population in Minneapolis and account for 25.9 percent of total realtor.com® page views in the area.

Minneapolis is the perfect city for millennials who love a mix of natural amenities and urban living. The area is home to 17 Fortune 500 companies, including UnitedHealth Group, Target, Best Buy, and 3M. It’s also home to a thriving cycling culture, with the second (only to Portland) most bike commuters of all big cities. The city is relatively affordable, but it’s become more difficult for first-time buyers to find homes under $250,000. When they do, they are often outbid by cash offers from boomers.

5. Omaha – The median list price in Omaha is $283,000. On average, millennials earn $63,500 annually. Millennials make up 13.8 percent of the total population in Omaha and account for 25.9 percent of total realtor.com® page views in the area.

Millennials are drawn to Omaha for its low cost of living, strong school system, and thriving job market. With schools such as Spring Ridge Elementary, Aldrich Elementary, and Hitchcock Elementary, all of which scored 9/10 by Greatschools.org, the area is great for millennials who want to start families. It offers strong financial, medical and military jobs with companies such as Nebraska Medicine, Taylor Telecommunications, and Union Pacific Railroad Co. Millennials looking to find homes under $250,000 are struggling, but boomers purchasing more expensive homes continue to have success closing.

Methodology

Realtor.com® analyzed the largest 60 metros in the country with large populations of older millennial markets. Markets were then ranked based on inventory availability and affordability.

About realtor.com®

Realtor.com® is the home of home search, offering the most comprehensive source of for-sale properties, among competing national sites, and the information, tools and professional expertise to help people move confidently through every step of their home journey. It pioneered the world of digital real estate 20 years ago, and today is the trusted resource for home buyers, sellers and dreamers by making all things home simple, efficient and enjoyable. Realtor.com® is operated by News Corp [NASDAQ: NWS, NWSA] [ASX: NWS, NWSLV] subsidiary Move, Inc. under a perpetual license from the National Association of REALTORS®. For more information, visit realtor.com®.

Contact:

Lexie Puckett Holbert
lexie.puckett@move.com

Millennials Lead All Homebuyers, Even as Some Can’t Escape Their Parents

Washington, D.C. – March 14, 2018 (nar.realtor) Home purchases by millennials ticked up over the past year, but inventory constraints and higher housing costs kept their overall activity subdued and prevented some from leaving the more affordable confines of their Gen X and baby boomer parents’ homes.

NAR Logo

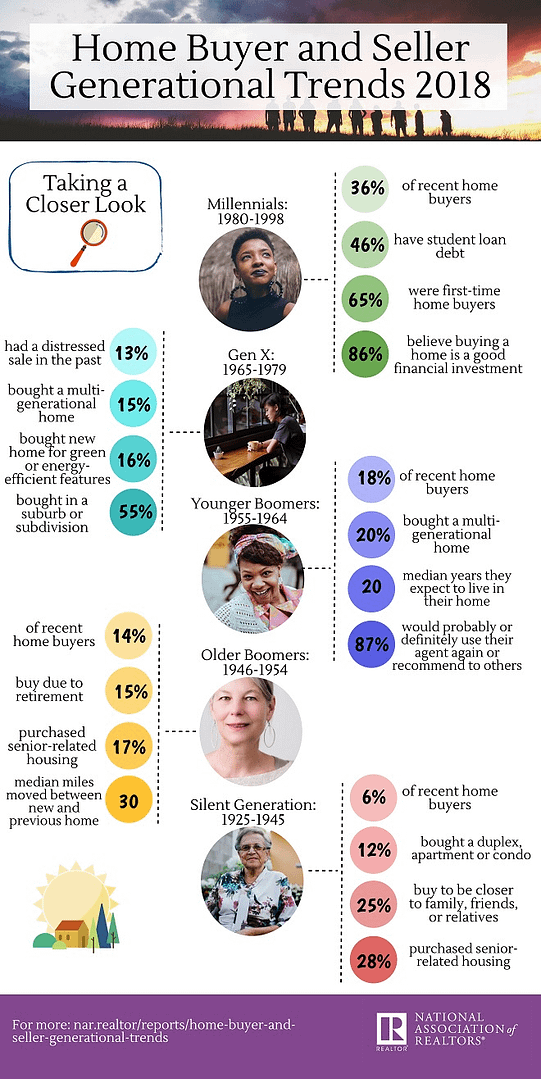
This is according to the National Association of Realtors® 2018 Home Buyer and Seller Generational Trends study, which evaluates the generational differences(1) of recent home buyers and sellers. The survey additionally found that millennial buyers prioritize living close to friends and family over a home’s location and proximity to schools, and an overwhelming majority used a real estate agent to buy or sell a home.

Slightly more than a third of all home purchases were made by millennials over the past year (36 percent; 34 percent in 2017), which kept them as the most active generation of buyers for the fifth consecutive year. Gen X buyers ranked second (26 percent; 28 percent in 2017), followed by younger (18 percent) and older baby boomers (14 percent) and the Silent Generation, those born between 1925 and 1945 (6 percent; 8 percent in 2017).

According to Lawrence Yun, NAR chief economist, this year’s survey findings reveal both what it takes to be a successful millennial buyer in today’s housing market, as well as why, even though sales to millennials reached an all-time survey high, stubbornly low inventory conditions pushed home prices out of reach for many. As a result, the overall share of millennial buyers remains at an underperforming level.

Real Estate Infographic

Revealing the greater purchasing power needed over the past year, the typical millennial buyer in the survey had a higher household income ($88,200) than a year ago ($82,000) and purchased the same-sized home (1,800-square-feet) at a more expensive price ($220,000; $205,000 in 2017). Millennials also had higher student debt balances than in last year’s survey, and slightly more of them said saving for a down payment was the most difficult task in buying a home.

“Realtors® throughout the country have noticed both the notable upturn in buyer interest from young adults over the past year, as well as mounting frustration once they begin actively searching for a home to buy,” said Yun. “Prices keep rising for the limited number of listings on the market they can afford, which is creating stark competition, speedy price growth and the need to save more in order to buy.”

Added Yun, “These challenging market conditions have caused – and will continue to cause – many aspiring millennial buyers to continue renting unless more Gen Xers decide to sell, and entry-level home construction picks up significantly.”

Other key findings and notable generational trends of buyers and sellers in this year’s 144-page survey include:

Younger boomers and Gen X buyers increasingly have children and parents living at home
Similar to previous years, younger boomers were the most likely to purchase a multi-generational home (20 percent), with a noteworthy rise in those indicating the top reason they did was for their adult children (above 18 years old) to live at home (39 percent; 30 percent in 2017), as well as their parents (22 percent; 18 percent in 2017).

The survey also found a growing a share of Gen X buyers buying for multi-generational purposes (15 percent; 12 percent in 2017), with a big jump in the top reason being for their adult children (35 percent; 26 percent in 2017) and parents living with them (30 percent; 19 percent in 2017).

“Costly rents and growing student debt balances appear to make living at home more appealing, affordable and increasingly more common among young adults just entering the workforce,” said Yun. “Even in situations where three generations are all cramped under the same roof, it can significantly help some millennials eventually transition straight to homeownership. Eighteen percent of millennial buyers in the survey said their family home was their previous living arrangement.”

Friends and family matter for buyers both young and old
When deciding where to buy a home, quality of the neighborhood is the factor most influencing buyers of all ages, followed closely by convenience to a job for those up to working age (millennials to younger boomers). Interestingly, even more than the location and quality of a school, recent millennial buyers were just as likely as older boomers and the Silent Generation (at 43 percent) to consider proximity to friends and family.

“The sense of community and wanting friends and family nearby is a major factor for many homebuyers of all ages,” said Yun. “Similar to Gen X buyers who have their parents living at home, millennial buyers with kids may seek the convenience of having family nearby to help raise their family.”

Millennials buying condos in the city at a very low rate
The share of millennial buyers with at least one child continues to grow, at 52 percent in this year’s survey and up from 49 percent a year ago and 43 percent in 2015. With the need for a larger house at an affordable price, over half of millennials bought in a suburban location (52 percent), while also being more likely than Gen Xers and younger boomers to choose a home in a small town. After climbing as high as 21 percent in 2015, only 15 percent of recent millennial buyers purchased a home in an urban area.

Led by Gen X (86 percent) and millennial buyers (85 percent), a detached single-family home continues to be the primary type of property purchased, and older and younger boomers were the most likely to buy a multi-family home. Only 2 percent of millennial buyers over the past year bought a condo.

“While there is an overall trend among households young and old to migrate towards urban areas, the very low production of new condos means there are few affordable options for buyers – especially millennials,” said Yun.

Regardless of age, most buyers and sellers work with a real estate agent
Buyers and sellers across all age groups continue to seek the assistance of a real estate agent when buying and selling a home. At 90 percent, millennials were the most likely to purchase a home through a real estate agent, and help understanding the buying process was cited as the top benefit millennials said their agent provided (75 percent). Overall, at least 84 percent in every other generation worked with an agent to close the deal.

On the seller side, Gen X and older boomers were the most likely to use an agent (91 percent), followed closely by millennials (90 percent) and younger boomers (88 percent). The near universal use of an agent to sell a home helped keep for-sale-by-owner transactions at their lowest share ever for the third straight year (8 percent).

“Especially in today’s fast-moving housing market, consumers of all ages want a Realtor® to guide them through the exhilarating, yet nerve-wracking experience of buying or selling a home,” said NAR President Elizabeth Mendenhall, a sixth-generation Realtor® from Columbia, Missouri and CEO of RE/MAX Boone Realty.

NAR mailed a 131-question survey in July 2017 using a random sample weighted to be representative of sales on a geographic basis to 145,800 recent home buyers. Respondents had the option to fill out the survey via hard copy or online; the online survey was available in English and Spanish. A total of 7,866 responses were received from primary residence buyers. After accounting for undeliverable questionnaires, the survey had an adjusted response rate of 5.6 percent. The sample at the 95 percent confidence level has a confidence interval of plus-or-minus 1.10 percent.

The recent home buyers had to have purchased a home between July 2016 and June 2017. All information is characteristic of the 12-month period ending in June 2017 with the exception of income data, which are for 2016.

The National Association of Realtors® is America’s largest trade association, representing 1.3 million members involved in all aspects of the residential and commercial real estate industries.

###

1. Survey generational breakdowns: millennials (ages 37 and under); Generation X (ages 38-52); younger boomers (ages 52-61); older boomers (ages 62-70); and the Silent Generation (ages 71-91).

One Third of New Yorkers Go Over Budget on Housing Costs; Millennials Most Likely to Spend More

StreetEasy’s NYC Housing & Moving Trends Report explores perceptions of affordability among New York renters and owners, their plans to move, and the motivations behind their housing decisions

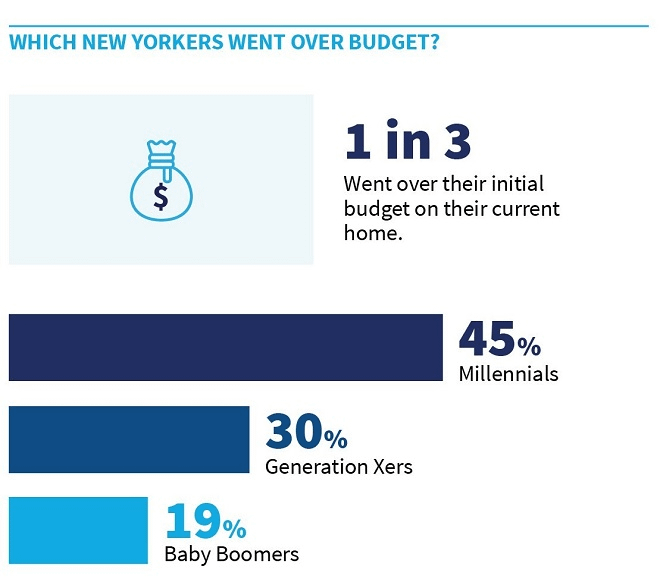
New York, NY – Feb. 20, 2018 (PRNewswire) New Yorkers pay 1.3 times more for housing in absolute terms than average Americans(i). To accommodate high housing costs, nearly one third of New Yorkers (31 percent) exceeded their initial budget on their current home, according to the new StreetEasy New York City Housing & Moving Trends Report(ii). Homeowners were more likely to overspend: 37 percent went over their initial home budget, compared to 27 percent of renters.

Streeteasy Logo

The StreetEasy report surveyed 1,000 renters and homeowners living across all five boroughs, and details the ways New Yorkers struggle to find an affordable home after the rapid rise in prices and rents over the last decade. According to the survey, there are stark differences in how different generations, homeowners, and renters tackle and perceive the high costs of housing in New York City.

Millennials(iii) are more likely than any other generation to exceed their budget, with 45 percent choosing a more expensive home than they’d planned on, compared to 30 percent of Generation Xers and 19 percent of baby boomers. Millennials are also most likely to consider buying a home in the next year, with more than one third (34 percent) hoping to do so.

Real Estate Infographic

“Younger New Yorkers, many of whom came to New York City to take advantage of the career opportunities it offers, are finding a housing market that is expensive, fast-moving and highly competitive,” said StreetEasy Senior Economist Grant Long. “But despite facing rising housing costs and budgeting constraints, aspirations of owning a home remain high in the city, particularly among millennials. While New Yorkers’ widespread desire to remain in the city is encouraging, the region’s continued success depends on maintaining an adequate supply of affordable homes that fit the priorities of its growing workforce.”

Most surveyed New Yorkers cited budget and number of bedrooms as the most important factors in a home, with 88 percent and 79 percent of residents citing them as a requirement or desire, respectively. Luxury amenities, such as doormen and gyms, ranked as the least important factors. Fifty-four and 64 percent of New Yorkers say these features had no impact on their home decision, respectively.

Asked to rate which factors they required or desired of their current neighborhood, safety and access to public transportation were most important to New Yorkers. Ninety percent of residents cite safety as a requirement or desire, and 87 percent mention access to public transportation — a pattern true for both owners and renters.

Additional report findings:

  • Many New Yorkers perceive New York City as unaffordable (46 percent). However, when asked to rate the affordability of their own homes, just 16 of New Yorkers say their home is unaffordable, revealing a dissonance in the perception of the city’s housing costs.
  • Most New Yorkers would recommend life in NYC (57 percent), particularly millennials (67 percent) and homeowners (65 percent).
  • Renters are significantly more likely to rate the cost of the city negatively: More than half (52 percent) of renters say New York City is unaffordable, compared to 39 percent of homeowners.
  • More than 1 in 3 New Yorkers plan to move in the next year. The majority are considering staying in their borough (71 percent); fewer plan to stay in their neighborhood (36 percent).
  • More than one third (39 percent) of New Yorkers cite the high cost of living as a top reason they would leave, with the desire for a bigger home and to buy a home also ranking highly (32 percent and 29 percent, respectively).

Access the full report:
The full StreetEasy NYC Housing & Moving Trends Report with additional findings and graphics is available to view and download at streeteasy.com/blog/2018-housing-moving-trends-report.

About StreetEasy
StreetEasy is New York City’s leading local real estate marketplace on mobile and the web, providing accurate and comprehensive for-sale and for-rent listings from hundreds of real estate brokerages throughout New York City and the NYC metropolitan area. StreetEasy adds layers of proprietary data and useful search tools to help home shoppers and real estate professionals navigate the complex real estate markets within the five boroughs of New York City, as well as Northern New Jersey.

Launched in 2006, StreetEasy is based in the Flatiron neighborhood of Manhattan. StreetEasy is owned and operated by Zillow Group (NASDAQ: Z and ZG).

StreetEasy is a registered trademark of Zillow, Inc.

(i) United States Census Bureau. 2012 – 2016 American Community Survey. U.S. Census Bureau’s American Community Survey Office, 2016.

(ii) StreetEasy partnered with independent market research firm YouGov to conduct a representative online survey that was fielded in November 2017. The results underwent substantial internal analysis and review by researchers and economists at StreetEasy. This survey gathered information from 1,000 key household decision-makers living in all five boroughs of New York City. Roughly half of the respondents were renters and half were homeowners.

(iii) For the purposes of this report, StreetEasy defined each generation breakdown as the following: generation Z, 18–22 years old; millennials, 23–37 years old; Generation Xers, 38–52 years old; baby boomers, 53–72 years old; and silent generation, 73 years old and above.