StreetEasy’s NYC Housing & Moving Trends Report explores perceptions of affordability among New York renters and owners, their plans to move, and the motivations behind their housing decisions
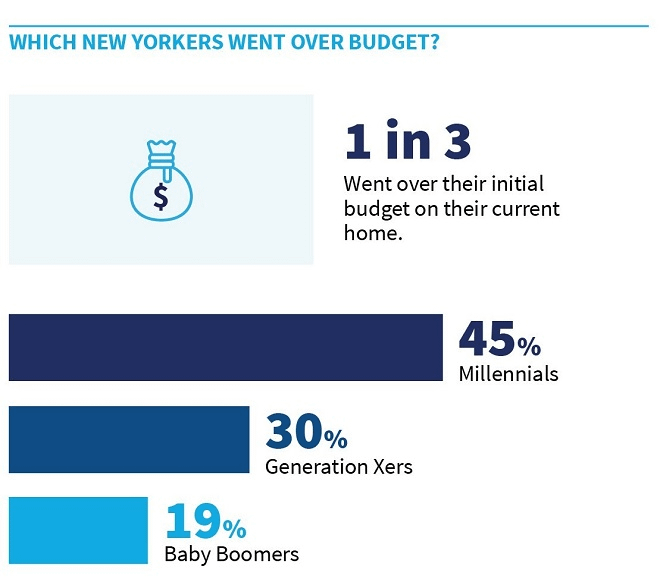
New York, NY – Feb. 20, 2018 (PRNewswire) New Yorkers pay 1.3 times more for housing in absolute terms than average Americans(i). To accommodate high housing costs, nearly one third of New Yorkers (31 percent) exceeded their initial budget on their current home, according to the new StreetEasy New York City Housing & Moving Trends Report(ii). Homeowners were more likely to overspend: 37 percent went over their initial home budget, compared to 27 percent of renters.
![]()
The StreetEasy report surveyed 1,000 renters and homeowners living across all five boroughs, and details the ways New Yorkers struggle to find an affordable home after the rapid rise in prices and rents over the last decade. According to the survey, there are stark differences in how different generations, homeowners, and renters tackle and perceive the high costs of housing in New York City.
Millennials(iii) are more likely than any other generation to exceed their budget, with 45 percent choosing a more expensive home than they’d planned on, compared to 30 percent of Generation Xers and 19 percent of baby boomers. Millennials are also most likely to consider buying a home in the next year, with more than one third (34 percent) hoping to do so.
“Younger New Yorkers, many of whom came to New York City to take advantage of the career opportunities it offers, are finding a housing market that is expensive, fast-moving and highly competitive,” said StreetEasy Senior Economist Grant Long. “But despite facing rising housing costs and budgeting constraints, aspirations of owning a home remain high in the city, particularly among millennials. While New Yorkers’ widespread desire to remain in the city is encouraging, the region’s continued success depends on maintaining an adequate supply of affordable homes that fit the priorities of its growing workforce.”
Most surveyed New Yorkers cited budget and number of bedrooms as the most important factors in a home, with 88 percent and 79 percent of residents citing them as a requirement or desire, respectively. Luxury amenities, such as doormen and gyms, ranked as the least important factors. Fifty-four and 64 percent of New Yorkers say these features had no impact on their home decision, respectively.
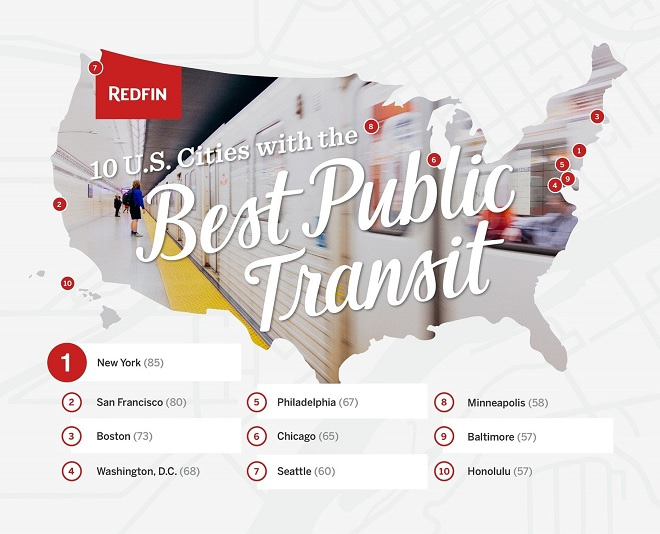
Asked to rate which factors they required or desired of their current neighborhood, safety and access to public transportation were most important to New Yorkers. Ninety percent of residents cite safety as a requirement or desire, and 87 percent mention access to public transportation — a pattern true for both owners and renters.
Additional report findings:
- Many New Yorkers perceive New York City as unaffordable (46 percent). However, when asked to rate the affordability of their own homes, just 16 of New Yorkers say their home is unaffordable, revealing a dissonance in the perception of the city’s housing costs.
- Most New Yorkers would recommend life in NYC (57 percent), particularly millennials (67 percent) and homeowners (65 percent).
- Renters are significantly more likely to rate the cost of the city negatively: More than half (52 percent) of renters say New York City is unaffordable, compared to 39 percent of homeowners.
- More than 1 in 3 New Yorkers plan to move in the next year. The majority are considering staying in their borough (71 percent); fewer plan to stay in their neighborhood (36 percent).
- More than one third (39 percent) of New Yorkers cite the high cost of living as a top reason they would leave, with the desire for a bigger home and to buy a home also ranking highly (32 percent and 29 percent, respectively).
Access the full report:
The full StreetEasy NYC Housing & Moving Trends Report with additional findings and graphics is available to view and download at streeteasy.com/blog/2018-housing-moving-trends-report.
About StreetEasy
StreetEasy is New York City’s leading local real estate marketplace on mobile and the web, providing accurate and comprehensive for-sale and for-rent listings from hundreds of real estate brokerages throughout New York City and the NYC metropolitan area. StreetEasy adds layers of proprietary data and useful search tools to help home shoppers and real estate professionals navigate the complex real estate markets within the five boroughs of New York City, as well as Northern New Jersey.
Launched in 2006, StreetEasy is based in the Flatiron neighborhood of Manhattan. StreetEasy is owned and operated by Zillow Group (NASDAQ: Z and ZG).
StreetEasy is a registered trademark of Zillow, Inc.
(i) United States Census Bureau. 2012 – 2016 American Community Survey. U.S. Census Bureau’s American Community Survey Office, 2016.
(ii) StreetEasy partnered with independent market research firm YouGov to conduct a representative online survey that was fielded in November 2017. The results underwent substantial internal analysis and review by researchers and economists at StreetEasy. This survey gathered information from 1,000 key household decision-makers living in all five boroughs of New York City. Roughly half of the respondents were renters and half were homeowners.
(iii) For the purposes of this report, StreetEasy defined each generation breakdown as the following: generation Z, 18–22 years old; millennials, 23–37 years old; Generation Xers, 38–52 years old; baby boomers, 53–72 years old; and silent generation, 73 years old and above.