LendingTree Ranks Metros with the Most Fraud Alerts

LendingTree uses anonymized customer data to determine where people were most likely to request that a fraud alert be placed on their credit reports

Charlotte, NC – April 11, 2018 (PRNewswire) LendingTree®, the nation’s leading online loan marketplace, today released the findings of its study on where people are most likely to have asked a credit bureau to place a fraud alert on their credit report.

lendingtree

With millions of Americans affected by data breaches every year, such as recent revelations at Uber and Equifax, LendingTree decided to look at anonymized data from a sample of the over 7 million My LendingTree users to see where people are most likely to have asked a credit bureau to place a fraud alert on their credit report. My LendingTree, available online and at app stores, offers free credit monitoring that includes alerts within 30 minutes of activity on your credit report.

Key findings of the study:

  • The average rate of fraud alert requests among all cities reviewed is 6.4 percent.
  • Las Vegas and Houston tie for the highest rate of fraud alerts, at 13.6 percent.
  • Miami and New York are close behind, tied at 12.9 percent.
  • Rochester, N.Y. has the lowest rate of people requesting fraud alerts at 2 percent. Nearby Buffalo, N.Y. has 2.6 percent.

Big cities lead the pack

1 (tie) – Las Vegas, NV
My LendingTree users with fraud alerts: 13.6%

1 (tie) – Houston, TX
My LendingTree users with fraud alerts: 13.6%

3 (tie) – Miami, FL
My LendingTree users with fraud alerts: 12.9%

3 (tie) – New York, NY
My LendingTree users with fraud alerts: 12.9%

5 – San Jose, CA
My LendingTree users with fraud alerts: 11.8%

Rust Belt and Missouri cities have the fewest alerts

50 – Rochester, NY
My LendingTree users with fraud alerts: 2%

49 – Buffalo, NY
My LendingTree users with fraud alerts: 2.6%

47 (tie) – St. Louis, MO
My LendingTree users with fraud alerts: 2.8%

47 (tie) – Pittsburgh, PA
My LendingTree users with fraud alerts: 2.8%

Chart

For more information on the study, visit https://www.lendingtree.com/finance/metros-with-most-fraud-alerts/

About LendingTree
LendingTree (NASDAQ: TREE) is the nation’s leading online loan marketplace, empowering consumers as they comparison-shop across a full suite of loan and credit-based offerings. LendingTree provides an online marketplace which connects consumers with multiple lenders that compete for their business, as well as an array of online tools and information to help consumers find the best loan. Since inception, LendingTree has facilitated more than 65 million loan requests. LendingTree provides free monthly credit scores through My LendingTree and access to its network of over 500 lenders offering home loans, personal loans, credit cards, student loans, business loans, home equity loans/lines of credit, auto loans and more. LendingTree, LLC is a subsidiary of LendingTree, Inc. For more information go to www.lendingtree.com, dial 800-555-TREE, like our Facebook page and/or follow us on Twitter @LendingTree.

MEDIA CONTACT:

Megan Greuling
(704) 943-8208
Megan.greuling@lendingtree.com

Redfin Report: Seattle and Honolulu Move up the Ranks of the Best Cities for Public Transit in 2018

New York, San Francisco and Boston Top the 2018 Transit Score Rankings

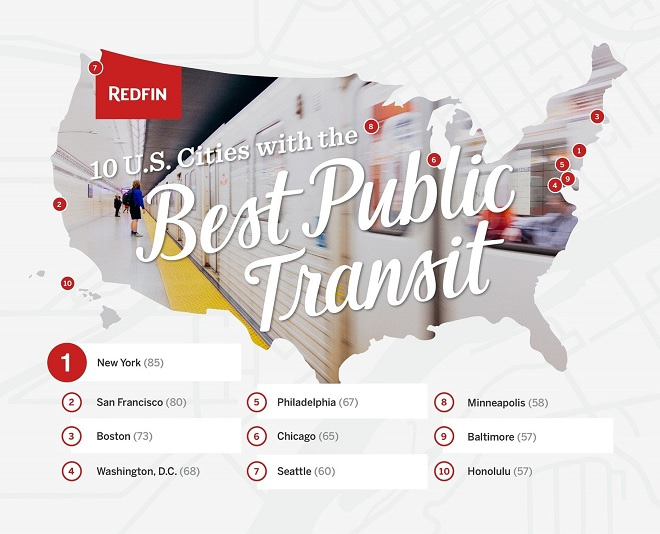
Seattle, WA – Feb. 21, 2018 (PRNewswire) (NASDAQ: RDFN) — New York, San Francisco and Boston are 2018’s best cities for public transit according to new Transit Score® rankings by Redfin (www.redfin.com), the next-generation real estate brokerage. Transit Score, a tool by Redfin company Walk Score®, rates locations based on how convenient they are to public transportation. Each of the top three cities has a Transit Score above 70, meaning it has an excellent transit rating, with public transportation being a convenient option for most trips.

Redfin Logo

While the rank order for the six best cities for public transit has stayed the same since 2012 when Transit Score first launched, there was a lot of movement at the bottom of the top-10 list.

In 7th place, Seattle has a Transit Score of 59.6, up 2.6 points since 2016, the biggest jump among the top 10. In the past two years, Seattle has expanded its Link light rail service, adding two new stations in 2016, making it easier and faster to get to Capitol Hill and the University of Washington. A 2017 survey by the Seattle Department of Transportation found that public transit use had increased by 48 percent in the past seven years.

“Seattle is not only the coolest city in the country – we are now one of the most transit-friendly cities,” said Seattle Mayor Jenny Durkan. “For our visitors, commuters and residents, public transit is safe, affordable, and a vital component in making sure our city is accessible to all. With the opening of new light rail stations and one of the highest bus riderships in the country, Seattle is making significant strides towards becoming a world-class transit city.”

Honolulu gained 1.6 points of Transit Score since 2016 and entered the top 10 list for the first time, replacing Miami. More than 69 million passengers in Honolulu ride TheBus annually and the city is planning a new rail system to further improve public transportation.

Real Estate Infographic

“Honolulu has been a public transportation city for many years now and the fact that our residents and visitors use TheBus an average of 214,000 trips every weekday is a testament to this fact,” said Honolulu Mayor Kirk Caldwell. “The new Transit Score ranking announced today by Redfin is proof that the nearly 2,000 workers who keep our bus system running strive for excellence each and every day, and our commitment to a transit system that covers all of O’ahu will only improve once our rail project begins service along our busiest and most populated corridor.”

Below is a ranking of the top 10 U.S. cities (with populations of more than 300,000) for public transit.

Chart

Washington, D.C., had the largest decrease among all major cities in Transit Score, dropping 2.2 points over the past two years to 68.5 in 2018. The decrease can be attributed to changes in Metrobus and Metrorail scheduling, where some bus routes were discontinued and the frequency of trains during rush hour was lowered.

“Once touted as the gold standard for public transit, D.C.’s Metro is now reckoning with decades of deferred maintenance,” said Redfin Washington D.C. agent John Marcario. “Tough decisions to reduce service and shut down lines for extended periods for repair are causing short-term frustration, but will hopefully make the system better in the long run. Despite the fall in Transit Score, access to transit remains a top priority for D.C. home buyers, who are still willing to pay a premium to live near a metro station.”

Bakersfield, CA (-2.2), Miami, FL (-2.2), Boston, MA (-1.8) and Baltimore, MD (-0.6) rounded out the cities with the biggest Transit Score decreases from 2016 to 2018.

With the addition of 600 new U.S. cities and more than 4,000 new neighborhoods, Transit Score ratings are now available for more than 900 cities and nearly 15,000 neighborhoods on walkscore.com. Among the newly added cities are big ones like Jacksonville, FL (22.4) and Charlotte, NC (27.4), along with smaller cities with Transit Score ratings like Hartford, CT (54.2) and Syracuse, NY (44.1).

The full report that includes a breakdown of the cities with the biggest Transit Score increases and a detailed methodology can be found here.

About Redfin
Redfin (www.redfin.com) is the next-generation real estate brokerage, combining its own full-service agents with modern technology to redefine real estate in the consumer’s favor. Founded by software engineers, Redfin has the country’s #1 brokerage website and offers a host of online tools to consumers, including the Redfin Estimate, the automated home-value estimate with the industry’s lowest published error rate for listed homes. Homebuyers and sellers enjoy a full-service, technology-powered experience from Redfin real estate agents, while saving thousands in commissions. Redfin serves more than 80 major metro areas across the U.S. The company has closed more than $50 billion in home sales.

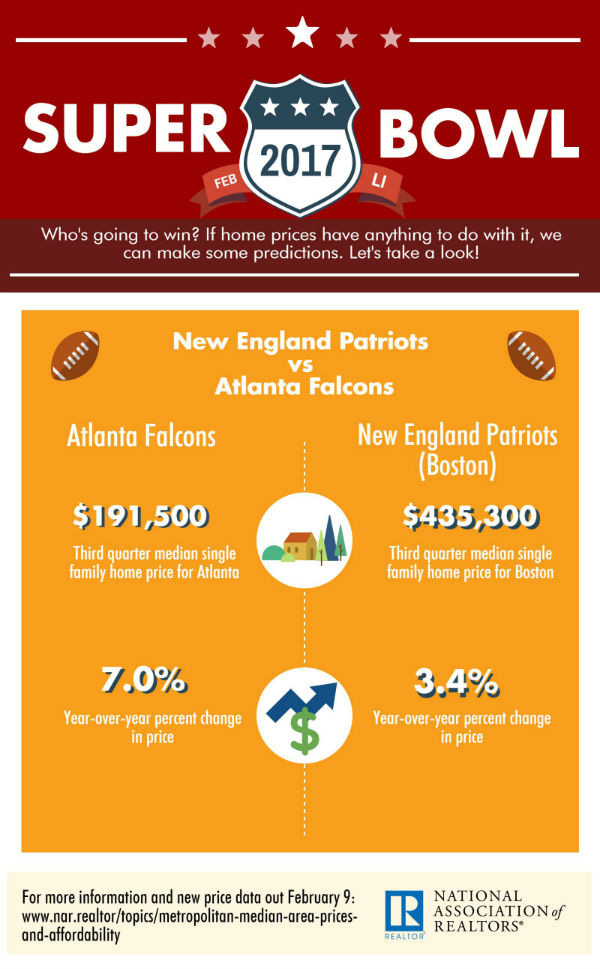
The Super Bowl and Metro Home Prices

Think you know which team is going to win the Super Bowl this weekend? How do their metro area home prices stack up? This infographic takes a look.

The data in this infographic comes from NAR’s Metropolitan Median Area Prices and Affordability statistics.

Super Bowl and Metro Home Prices Infographic