Source: nar.realtor
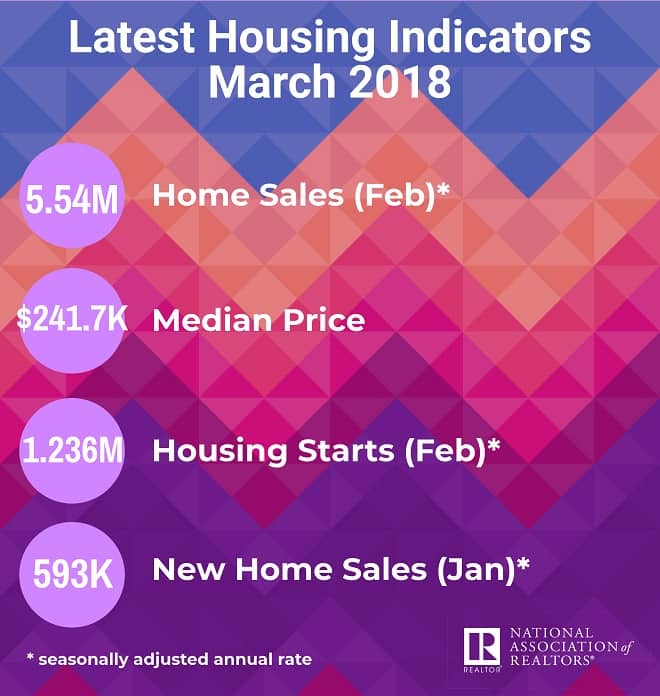
This infographic, from nar.realtor, shows the latest housing numbers for home sales, median home prices, housing starts, and new home sales.

Source: nar.realtor
This infographic, from nar.realtor, shows the latest housing numbers for home sales, median home prices, housing starts, and new home sales.
Houston, Dallas, Denver, San Jose, San Antonio Prices 50+ Percent Above Previous Peaks; Average U.S. Homeownership Tenure Posts Biggest Quarterly Drop Since Q4 2008; Report Includes Analysis of High-End Sales in Wake of Tax Reform
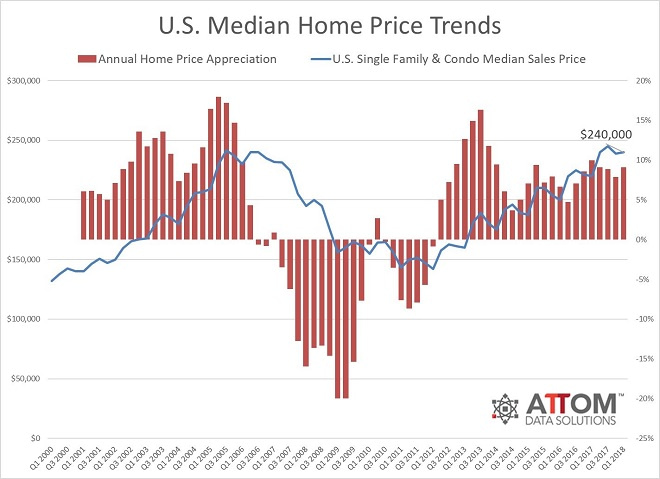
Irvine, CA – April 19, 2018 (PRNewswire) ATTOM Data Solutions, curator of the nation’s premier property database, today released its Q1 2018 U.S. Home Sales Report, which shows that median home prices in 57 of 105 metropolitan statistical areas analyzed in the report (54 percent) were above their pre-recession home price peaks in the first quarter.
![]()
Nationwide the median home price of $240,000 in Q1 2018 was less than 1 percent below its pre-recession peak of $241,500 in Q3 2005, but still up 9.1 percent from a year ago. Metro areas with Q1 2018 median home prices the furthest above their pre-recession peaks were Houston, Texas (69 percent above); Dallas-Fort Worth, Texas (67 percent above); Denver, Colorado (62 percent above); San Jose, California (60 percent above); and San Antonio, Texas (57 percent above).
Other major metros with at least 1 million people and with Q1 2018 median home prices at least 30 percent above pre-recession peaks were Nashville, Tennessee (46 percent above); Austin, Texas (45 percent above); Salt Lake City, Utah (42 percent above); Raleigh, North Carolina (35 percent above); Indianapolis, Indiana (31 percent above); and Oklahoma City, Oklahoma (30 percent above).
“Rising interest rates and recently enacted tax reform that removed some tax incentives for homeownership were not enough to cool off red-hot home price appreciation in many parts of the country, with 30 of the 105 local markets analyzed posting double-digit gains in median home prices in the first quarter,” said Daren Blomquist, senior vice president at ATTOM Data Solutions. “Home prices are still below pre-recession peaks in 46 percent of local markets, but nearly one-third of even those markets posted double-digit home price appreciation in the first quarter.”
Prices in Philadelphia, Hartford, Chicago, Baltimore, Tucson still below pre-recession peaks
Median home prices in 48 of the 105 metro areas analyzed in the report (46 percent) were still below pre-recession peaks in Q1 2018, led by Bridgeport-Stamford-Norwalk, Connecticut (25 percent below); New Haven, Connecticut (22 percent below); Allentown, Pennsylvania (21 percent below); Philadelphia, Pennsylvania (20 percent below); and Hartford, Connecticut (19 percent below).
Along with Philadelphia and Hartford, other major metros with at least 1 million people and with Q1 2018 median home prices at least 15 percent below pre-recession peaks were Chicago, Illinois (19 percent below); Baltimore, Maryland (17 percent below); Tucson, Arizona (16 percent below); Las Vegas, Nevada (16 percent below); and New York-Newark-Jersey City (15 percent below).
San Jose, Flint, Spokane, Reno, Seattle post biggest annual home price increases
Among the 105 metropolitan statistical areas analyzed in the report, those posting the biggest year-over-year increase in median home prices were San Jose, California (up 33 percent); Flint, Michigan (up 20 percent); Spokane, Washington (up 18 percent); Reno, Nevada (up 17 percent); and Seattle, Washington (up 16 percent).
“In 2018 and in the next couple of years, we’ll see more markets where home prices are entering boom territory. It’s strange to say after so many years of stagnation, but buyers will want to beware right now in Denver, Miami, the LA area, Austin, San Francisco, Tampa and Seattle, where home prices are already 25 percent higher than they should be,” said Ingo Winzer, founder and president at Local Market Monitor. “We don’t think a bust is imminent — in fact we think prices in these markets will keep going up for several years — but dynamics like this have always ended badly in the past. If you’re thinking of selling, this year or next would be a good time. If you’re thinking of buying, either have a very short-term outlook or a very long one.”
Homeownership tenure posts largest quarterly drop since Q4 2008
U.S. homeowners who sold in Q1 2018 had been in their homes an average of 8.00 years, down 2 percent from 8.14 years in Q4 2017 — the biggest quarterly drop in average homeownership tenure since Q4 2008 — but still up from 7.69 years in Q1 2017.
Among 40 metropolitan statistical areas with a population of at least 1 million, those with the biggest quarterly drop in average homeownership tenure were Cleveland, Ohio (down 6 percent); Seattle, Washington (down 6 percent); Salt Lake City, Utah (down 5 percent); Minneapolis-St. Paul, Minnesota (down 4 percent); and Sacramento, California (down 4 percent).
Average home seller gains down from previous quarter, up from year ago
U.S. homeowners who sold in Q1 2018 realized an average home price gain since purchase of $53,369, down from an average gain of $54,000 in Q4 2017 but still up from an average gain of $45,000 in Q1 2017. The average home seller gain of $53,369 in Q1 2018 represented an average 29.5 percent return as a percentage of original purchase price, down from a 29.8 percent return in the previous quarter but still up from a 25.7 percent return in Q1 2017.
Among 154 metropolitan statistical areas analyzed in the report, those with the highest average home seller returns in Q1 2018 were San Jose, California (109.1 percent); San Francisco, California (73.6 percent); Seattle, Washington (66.0 percent); Kahului-Wailuku-Lahaina, Hawaii (65.3 percent); and Vallejo-Fairfield, California (58.8 percent).
High-end share of home sales increases from year ago to highest level in a decade
The report also included an analysis of high-end home sales trends in the wake of tax reform legislation passed in December that caps the mortgage interest deduction for federal income taxes at interest paid on $750,000 and caps the state and local tax deduction (including property taxes) at $10,000.
Nationwide homes selling for more than $1 million accounted for 4.18 percent of all U.S. single family home and condo sales in Q1 2018, up from 4.02 percent of all sales in Q4 2017 and up from 3.38 percent of all sales in Q1 2017 to the highest level since Q4 2007.
But the impact was varied depending on market. In San Jose, California, the nation’s highest-priced metro area with a median sales price of $1,150,000 in Q1 2018, the share of homes selling above $1 million increased from 39.37 percent in Q1 2017 to 58.95 percent in Q1 2018. In Westchester County, New York, which had the highest average property tax among 1,414 counties analyzed by ATTOM Data Solutions, the share of home selling above $1 million decreased from 17.68 percent in Q1 2017 to 15.05 percent in Q1 2018.
The analysis also looked at median price per square foot for homes that sold below and above $1 million. The median price per square foot of single family homes and condos that sold in the first quarter for under $1 million increased 10 percent from a year ago while the median price per square foot of homes that sold above $1 million increased 6 percent.
The price-per-square foot trends also varied by market. In Westchester County, New York, the median price per square foot for homes that sold above $1 million increased 2 percent compared to a year ago while the median price per square foot for homes that sold below $1 million increased 11 percent. In Santa Clara County in the San Jose metro area, the median price per square foot for homes that sold above $1 million increased 17 percent from a year ago while the median price per square foot for homes that sold below $1 million increased 16 percent.
Other high-level findings
Report methodology
The ATTOM Data Solutions U.S. Home Sales Report provides percentages of distressed sales and all sales that are sold to investors, institutional investors and cash buyers, a state and metropolitan statistical area. Data is also available at the county and zip code level upon request. The data is derived from recorded sales deeds, foreclosure filings and loan data. Statistics for previous quarters are revised when each new report is issued as more deed data becomes available for those previous months. Median sales price is calculated based on the sales price on the publicly recorded sales deed when available. If no sales price is recorded then the purchase loan amount is used to calculate median price, and if no purchase loan amount is available, the property’s Automated Valuation Model (AVM) at time of sale is used to calculate the median price.
Definitions
All-cash purchases: sales where no loan is recorded at the time of sale and where ATTOM has coverage of loan data.
Institutional investor purchases: residential property sales to non-lending entities that purchased at least 10 properties in a calendar year.
REO sale: a sale of a property that occurs while the property is actively bank owned (REO).
Third-party foreclosure auction sale: a sale of a property that occurs at the public foreclosure auction (trustee’s sale or sheriff’s sale) in which the property is sold to a third-party buyer and does not transfer back to the foreclosing bank.
Short sale: a sale of a property where the sale price is less than (short) the combined amount of loans secured by the property.
Data Licensing and Custom Report Order
Investors, businesses and government institutions can contact ATTOM Data Solutions to purchase the full dataset behind the Year-End U.S. Foreclosure Market Report, including data at the state, metro, county and zip code level. The data is also available via bulk license or in customized reports. For more information contact our Data Solutions Department at 800.462.5193 or datasales@attomdata.com.
About ATTOM Data Solutions
ATTOM Data Solutions provides premium property data to power products that improve transparency, innovation, efficiency and disruption in a data-driven economy. ATTOM multi-sources property tax, deed, mortgage, foreclosure, environmental risk, natural hazard, and neighborhood data for more than 155 million U.S. residential and commercial properties covering 99 percent of the nation’s population. A rigorous data management process involving more than 20 steps validates, standardizes and enhances the data collected by ATTOM, assigning each property record with a persistent, unique ID — the ATTOM ID. The 9TB ATTOM Data Warehouse fuels innovation in many industries including mortgage, real estate, insurance, marketing, government and more through flexible data delivery solutions that include bulk file licenses, APIs and customized reports.
Media Contact:
Christine Stricker
949.748.8428
christine.stricker@attomdata.com
Data and Report Licensing:
949.502.8313
datareports@attomdata.com
Homebuyers desiring built-in “green” amenities could find listings for less than median home values
Santa Clara, CA – April 19, 2018 (PRNewswire) Homes with eco-friendly features do not always command a premium price tag in today’s hot housing market, according to analysis from realtor.com®, a leading online real estate destination.
![]()
In honor of Earth Day, realtor.com® analyzed current listings in the top 200 U.S. metros to determine the market availability of “green” homes with any of seven eco-friendly features, such as solar panels, smart thermostats or bamboo floors, and evaluated how much more – or less – these homes may cost a prospective homebuyer.
“Although Southern and Western states still lead the way in green technology adoption, eco-friendly features have grown in popularity across many regions of the United States,” said Javier Vivas, director of economic research for realtor.com®. “Many buyers have come to expect standard features, and homes integrating specialty green features are becoming more mainstream. However, in today’s inventory-starved market, location still reigns supreme and the price of land can easily override the allure of special eco-friendly features.”
The “greenest” metro of them all
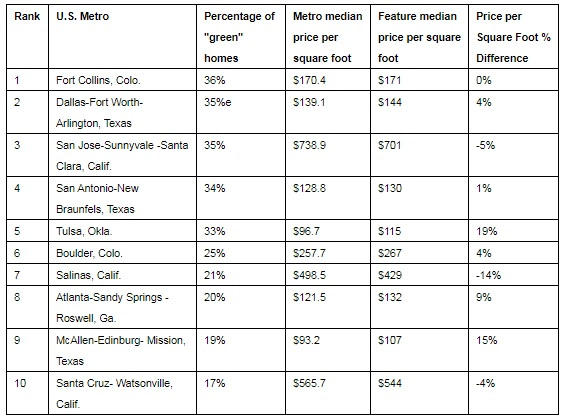
Prospective homebuyers in the Fort Collins, Colo. metro area have the highest likelihood of finding a home with integrated “green” features, with 36 percent of its April 2018 listings noting at least one sustainable living feature. Following closely behind are the Dallas-Fort Worth-Arlington, Texas and San Jose/Sunnyvale/Santa Clara, Calif., metro areas at 35 percent of listings each.
Although homes with eco-friendly features are four percent more expensive than the median home price in the Dallas metro area, there is essentially no price difference between “green” homes and the median home price in Fort Collins. Notably, homebuyers looking in Sunnyvale/San Jose/Santa Clara may find homes with sustainable living features for five percent less than the local median home price.
Of the top 10 “green” metros, buyers in Tulsa, Okla., will pay the biggest premium – 19 percent – if buying a home with existing eco-friendly features is a priority. Those in Salinas, Calif., have the biggest price advantage, as “green” listings are 14 percent below the median home price. However, while three California metros show that “green” homes are less expensive relative to the median home price in their respective areas, keep in mind that the median home price in each metro is significantly higher than those in other states.
Solar panels soak up the sun in California and Arizona
California dominated seven of the top ten markets with the highest concentration of listings featuring solar panels, with the San Jose-Sunnyvale-Santa Clara, Calif., area leading the list at 6.1 percent of total listed homes. Salinas, Calif., and Arizona’s Phoenix-Mesa-Scottsdale metro areas follow closely behind at 4.8 percent and 4.6 percent of total listings featuring solar panels, respectively.
Good news for buyers who want integrated solar panels in their new home: every market aside from Prescott, Ariz., and Fresno, Calif., showed that prices of solar panel homes were the same or less than the median home price in each market. In Salinas, Calif., buyers save on average $233,850 on homes featuring solar panels when compared to the metro’s median listing price of $917,050. However, in Prescott, Ariz., new homeowners will need to add $78,200 to the metro’s median home price of $400,050.
Programmable thermostats heat up home prices in Oklahoma, Alabama and Texas
Homes featuring programmable thermostats will likely cost homebuyers more, adding up to 20 percent in Montgomery, Ala., 17 percent in Tulsa, Okla., 15 percent in the McAllen-Edinburg-Mission, Texas metro area, and 12 percent in the Oklahoma City metro area.
The Tulsa metro area has the highest proportion of smart thermostat home listings at 31 percent, followed by San Antonio at 28 percent and Fort Collins, Colo. at 25 percent.
Some of the price differences may be attributed to the fact that median home prices in these four metros are all below the national median price of $280,000, ranging from $176,944 for Montgomery, Ala., to $239,650 for Oklahoma City.
ENERGY STAR-rated homes shine bright (and costly) in Connecticut
Four Connecticut metros have the highest concentration of ENERGY STAR-rated* home listings currently on the market, but most homebuyers will need to pay between 21 to 26 percent more than the median home price per square foot.
ENERGY STAR-rated homes make up four percent of current listings in each of Connecticut’s Norwich-New London, Hartford, and New Haven-Milford metro areas, adding 26 percent, 21 percent and 24 percent more to the price per square foot, respectively. ENERGY STAR-rated homes in the Greensboro-High Point, N.C., metro, the fifth highest concentration market at 1 percent of total listings, will cost buyers 41 percent more per square foot.
Of the top five metros, the only one that does not require a premium is the Bridgeport-Stamford-Norwalk metro area, where ENERGY STAR-rated homes account for slightly over 3 percent of active listings. While the median home price is the most expensive of the top five metros at $792,050, buyers can save $37,050 on average for a ENERGY STAR-rated home.
Top Markets with Green Amenities
Ranking of the top 200 largest U.S. metros with the highest percentage of active listings featuring at least one of seven “green” amenities in April 2018
Top Markets: Solar
Ranking of the top 200 largest U.S. metros with the highest percentage of active listings featuring solar panels in April 2018

Top Markets: Programmable Thermostats
Ranking of the top 200 largest U.S. metros with the highest percentage of active listings featuring programmable thermostats in April 2018

Top Markets: Energy Star-Rated Homes
Ranking of the top 200 largest U.S. metros with the highest percentage of active listings featuring Energy Star-rated homes in April 2018

Methodology
Realtor.com® looked at the active home listings in April 2018 to see which of the top 200 largest U.S. metro areas had the highest share of homes that included “green” features. To qualify for the list, the metro must have at least 30 listings that included the “green” feature. The eco-friendly features included for analysis are solar panels, bamboo flooring, smart thermostats, ENERGY STAR-rated homes, Seasonal Energy Efficiency Ratio (SEER) ventilation, dual pane windows and ENERGY STAR appliances.
* ENERGY STAR is a voluntary energy efficiency program managed by the U.S. Environmental Protection Agency (EPA) and the U.S. Department of Energy (DOE). New homes that earn the ENERGY STAR are at least 15 percent more efficient than those built to code. For more information: https://www.energystar.gov/about
About realtor.com®
Realtor.com® is the trusted resource for home buyers, sellers and dreamers, offering the most comprehensive source of for-sale properties, among competing national sites, and the information, tools and professional expertise to help people move confidently through every step of their home journey. It pioneered the world of digital real estate 20 years ago, and today helps make all things home simple, efficient and enjoyable. Realtor.com® is operated by News Corp [NASDAQ: NWS, NWSA] [ASX: NWS, NWSLV] subsidiary Move, Inc. under a perpetual license from the National Association of REALTORS®. For more information, visit realtor.com®.
Media Contact:
Realtor.com®
Tammy Lee – tammy.lee@realtor.com