Starbucks became the latest company to hit the pause button on social media advertising on Sunday, joining an evergrowing list of major brands that pulled their ads from social networks, and Facebook in particular, in an attempt to push for stronger action against hate speech on the part of social media companies.
“We will pause advertising on all social media platforms while we continue discussions internally, with our media partners and with civil rights organizations in the effort to stop the spread of hate speech,” Starbucks wrote in its official announcement of its decision, which puts the coffee chain alongside companies such as Coca-Cola, Unilever, Verizon, Patagonia and Levi’s, to name just a few. As opposed to the other companies mentioned above, Starbucks hasn’t officially joined the “Stop Hate for Profit” initiative, which singles out Facebook for its inaction against hate speech especially during the recent protests for racial justice in America.
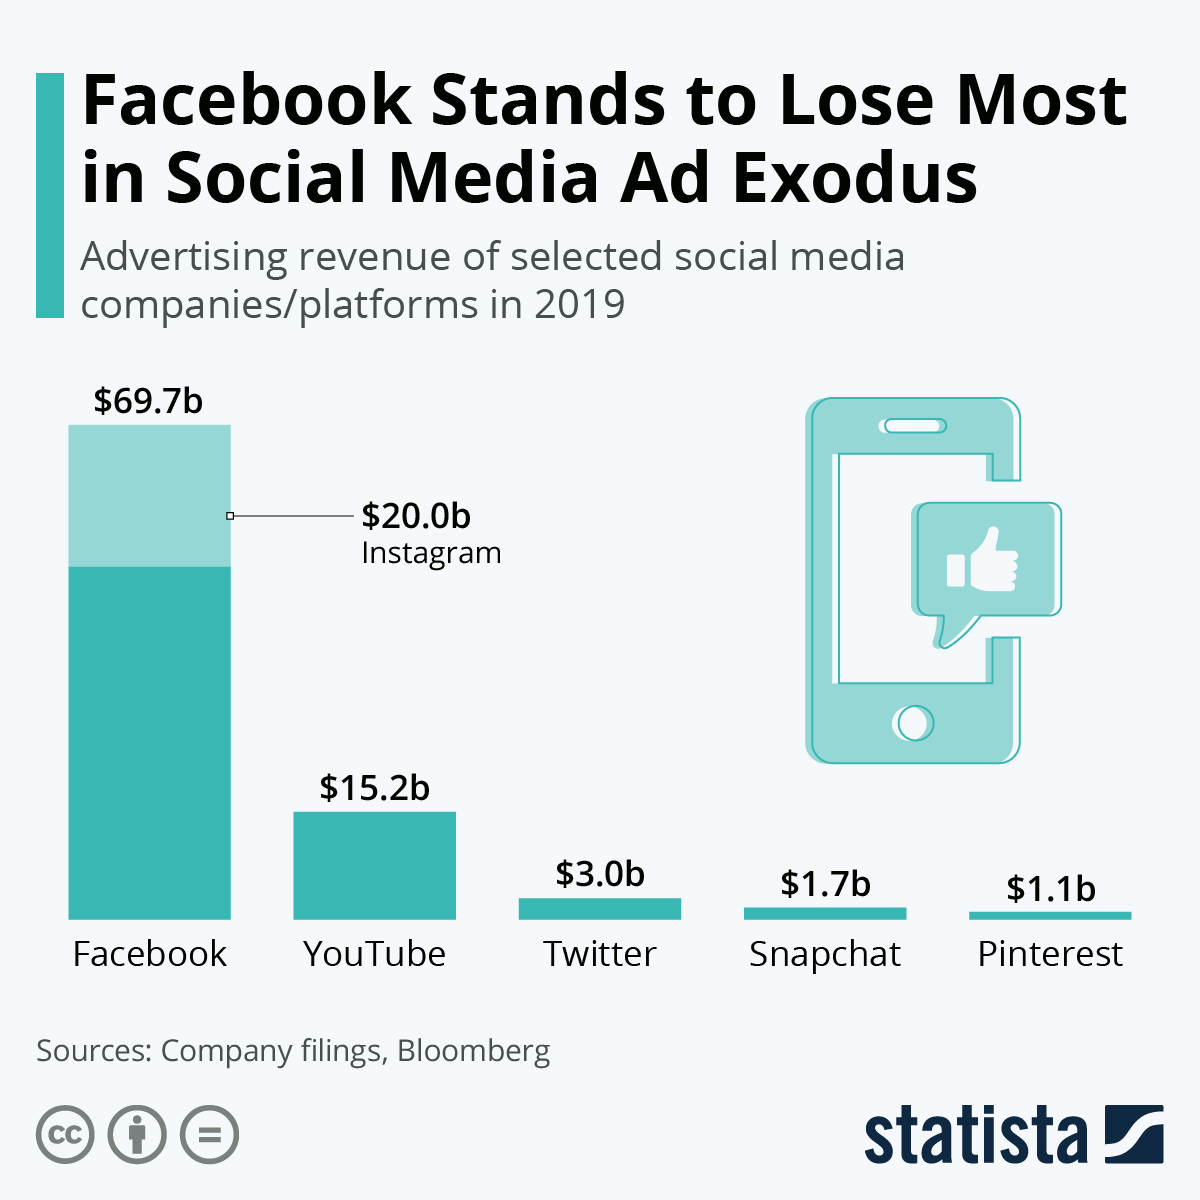
While several companies have paused social media advertising altogether, Facebook is currently taking the brunt of the boycott, as it is seen as the epitome of what is wrong with social media these days. As our chart shows, the company’s ad revenue amounted to nearly $70 billion last year, dwarfing the ad sales of its social media competitors.
Nationwide, 44% of Black families own their home versus 74% of white families
Seattle, WA – June 29, 2020 (PRNewswire) (NASDAQ: RDFN) — Just 44% of Black families own the home they live in as of the first quarter of 2020, up from 41.1% in the first quarter of 2019, an increase that may reverse as the coronavirus pandemic upends one of the “most promising economies in recent memory” for Black Americans. For white families, the national homeownership rate is 73.7%, up slightly from 73.2% in the first quarter of 2019. An additional breakdown of metro-level homeownership rates for Black and white families and the gap between them are available in a new report from Redfin (www.redfin.com), the technology-powered real estate brokerage.
Just 25% of Black families in Minneapolis own their home, the lowest Black homeownership rate of any metro area in the U.S. with more than 1 million residents. It’s followed by Milwaukee and Salt Lake City, where only 27% and 28% of Black families own the home they live in, respectively.
Those three metros, all with median home-sale prices below $325,000, are also three of the four metros with the biggest racial homeownership gaps. In Minneapolis, 76% of white families own their homes, which makes for a gap of 51 percentage points, followed by Grand Rapids (78%; 45 percentage-point gap), Salt Lake City (72%; 44 percentage-point gap) and Milwaukee (70%; 43 percentage-point gap). This metro-level data is from 2018, the most recent year for which it’s available.
“The homeownership gap between Black and white families is a problem that extends far beyond the realm of housing,” said Redfin economist Taylor Marr. “The value many Black families have missed out on because they were impacted by systemic racism in housing would have been passed down to children and grandchildren, paying for things like higher education, childcare, starting a business and down payments on their own home. Instead, younger generations in the Black community are at an unfair financial and social disadvantage.”
In Washington, DC, the metro with the highest Black homeownership rate, just over half of Black families (51%) own their home. It’s followed by Birmingham (50%) and Richmond, VA (49%). Washington, DC also has the smallest homeownership gap, with 72% of white families owning their home for a 21 percentage-point gap. Austin has the next-smallest gap, with a rate of 43% for Black families and 65% for white families, followed by Los Angeles (33% versus 58%).
“There are a lot of federal employment opportunities for Black individuals in DC, and those jobs provide good salaries that drive homeownership,” said local Redfin agent Thomas Mathis. “I also see a lot of parents passing homes on to their children. DC was predominantly Black at one time and a lot of those families have stayed in the area, which means their homes are still in the family. But there’s still plenty of room for improvement. One way to increase the Black homeownership rate is with understanding the power of owning a home. Plenty of Black families in the area have money, but often they haven’t been educated on how they could build wealth by purchasing a home.”
The Black homeownership rate has declined in most metros since 2012
Fewer or the same share of Black families owned their home in 2018 than 2012 in all but two of the metros included in Redfin’s report. And in both places where the rate has gone up—Hartford, CT and Austin—it has only increased by 1 percentage point, from 42% to 43%. The report uses 2012 as a comparison point because that’s when the housing market started to recover from the Great Recession.
The homeownership rate for Black families has declined most in Oklahoma City, from 42% in 2012 to 36% in 2018. In five other metros, the share of Black families who own their homes dropped by 5 percentage points over that time period: Detroit, Jacksonville, Miami, Memphis and Milwaukee.
Racist housing policies, debt and other reasons behind the national homeownership gap
Discriminatory housing policies were prevalent across the U.S. in the first half of the 20th century. One such example is redlining, which effectively blocked many Black families from obtaining mortgage loans, with a Redfin analysis finding that families in redlined neighborhoods have missed out on $212,000 in home equity over the last 40 years. Although those racist policies have been outlawed, they are major reasons why Black families have unfairly missed out on so much personal wealth from property gains, which helps explain why such a large share of housing remains unaffordable for Black families.
Rising home prices and income gaps are also problematic throughout the country. Home prices in majority-Black neighborhoods across the U.S. rose at double the rate of those in majority-white neighborhoods (25% versus 12.5%) from 2012 to 2018, making it difficult to break into the market. And while incomes for Black and white households have risen at a similar pace during that time period, Black households had a much lower median income than white households in 2018 ($41,511 versus $67,937). A Redfin analysis found there wasn’t a single major metro area in 2018 where more than half the homes for sale were affordable to Black households earning the median income.
Nearly 8% of Black households with mortgages lost their homes to foreclosure between 2007 and 2009 versus 4.5% of white families, another factor in the current homeownership gap. Banks subsequently tightened lending standards, making it more difficult to obtain mortgages, particularly for Black families. Accordingly, a December Redfin survey of first-time homebuyers found that Black respondents were more likely than white respondents to want the government to ease lending standards (56% versus 42%).
Student debt is another obstacle for Black Americans. In a Redfin survey from February 2020, 45% of Black respondents said student debt prevented them from trying to buy a home sooner, versus 31% of white respondents.
Moving toward systemic change in the housing market
Narrowing the homeownership gap should be a priority for lawmakers and the real estate industry. To that end, Redfin has successfully campaigned to eliminate pocket listings that can prevent minority homebuyers from seeing the most desirable homes for sale and supported controversial business taxes to fund more housing, among other initiatives, but systemic change in the housing market requires commitment from the real estate and construction industries along with federal and local governments.
About Redfin Redfin (www.redfin.com) is a technology-powered residential real estate company, including brokerage, iBuying, mortgage, and title services. Founded by software engineers, we run the country’s #1 most-visited brokerage website and offer a host of online tools to consumers, including the Redfin Estimate. We represent people buying and selling homes in over 90 markets in the United States and Canada. In a commission-driven industry, our mission is to redefine real estate in the consumer’s favor. We do this by pairing our own agents with our own technology to create a service that is faster, better, and costs less. Since our launch in 2006, we have helped customers buy or sell more than 235,000 homes worth more than $115 billion. For more information or to contact a local Redfin real estate agent, visit www.redfin.com. To learn about housing market trends and download data, visit the Redfin Data Center. To be added to Redfin’s press release distribution list, email press@redfin.com. To view Redfin’s press center, click here.
Washington, D.C. – June 29, 2020 (nar.realtor) Pending home sales mounted a record comeback in May, seeing encouraging contract activity after two previous months of declines brought on by the coronavirus pandemic, according to the National Association of Realtors®. Every major region recorded an increase in month-over-month pending home sales transactions, while the South also experienced a year-over-year increase in pending transactions.
The Pending Home Sales Index (PHSI),* www.nar.realtor/pending-home-sales, a forward-looking indicator of home sales based on contract signings, rose 44.3% to 99.6 in May, chronicling the highest month-over-month gain in the index since NAR started this series in January 2001. Year-over-year, contract signings fell 5.1%. An index of 100 is equal to the level of contract activity in 2001.
“This has been a spectacular recovery for contract signings, and goes to show the resiliency of American consumers and their evergreen desire for homeownership,” said Lawrence Yun, NAR’s chief economist. “This bounce back also speaks to how the housing sector could lead the way for a broader economic recovery.”
“More listings are continuously appearing as the economy reopens, helping with inventory choices,” Yun said. “Still, more home construction is needed to counter the persistent underproduction of homes over the past decade.”
According to data from realtor.com®, among the largest metro areas, active listings were up by more than 10% in May compared to April in several metro areas, including Urban Honolulu, Hawaii; San Francisco, Calif.; San Jose, Calif.; Denver, Colo.; and Colorado Springs, Colo.
“The outlook has significantly improved, as new home sales are expected to be higher this year than last, and annual existing-home sales are now projected to be down by less than 10% – even after missing the spring buying season due to the pandemic lockdown,” Yun said.
NAR now expects existing-home sales to reach 4.93 million units in 2020 and new home sales to hit 690,000. “All figures light up in 2021 with positive GDP, employment, housing starts and home sales.” Yun noted that in 2021, sales are forecast to rise to 5.35 million units for existing homes and 800,000 for new homes.
May Pending Home Sales Regional Breakdown
The month of May saw each of the four regional indices rise on a month-over-month basis after all were down in April 2020.
The Northeast PHSI grew 44.4% to 61.5 in May, although it was still down 33.2% from a year ago. In the Midwest, the index rose 37.2% to 98.8 last month, down 1.4% from May 2019.
Pending home sales in the South increased 43.3% to an index of 125.5 in May, up 1.9% from May 2019. The index in the West jumped 56.2% in May to 89.2, down 2.5% from a year ago.
The National Association of Realtors® is America’s largest trade association, representing more than 1.4 million members involved in all aspects of the residential and commercial real estate industries.
# # #
*The Pending Home Sales Index is a leading indicator for the housing sector, based on pending sales of existing homes. A sale is listed as pending when the contract has been signed but the transaction has not closed, though the sale usually is finalized within one or two months of signing.
The index is based on a large national sample, typically representing about 20% of transactions for existing-home sales. In developing the model for the index, it was demonstrated that the level of monthly sales contract activity parallels the level of closed existing-home sales in the following two months.
An index of 100 is equal to the average level of contract activity during 2001, which was the first year to be examined. By coincidence, the volume of existing-home sales in 2001 fell within the range of 5.0 to 5.5 million, which is considered normal for the current U.S. population.
NOTE: Existing-Home Sales for June will be reported on July 22. The next Pending Home Sales Index will be July 29; all release times are 10:00 a.m. ET.