Condo Prices Down 1.4% in June, Sales Down 31%, But Demand Is Ticking Up

Homebuyer demand for condos is recovering more slowly than demand for single-family homes since the pandemic began, but buyers seeking affordability are starting to return

Seattle, WA – July 31, 2020 (PRNewswire) (NASDAQ: RDFN) — Condo sale prices nationwide dropped 1.4% year over year to a median of $252,000 in June, the second consecutive month of drops after nearly two years of rising prices, according to a new report from Redfin (www.redfin.com), the technology-powered real estate brokerage. Prior to the pandemic, price growth for condos had reached a three-year high in January with a 9.7% year-over-year increase.

Contrast that with single-family homes, which saw their median sale price rise 2.6% year over year to $322,000 in June. Price growth for both condos (-2.4%) and single-family homes (+0.3%) bottomed out in May after the pandemic slowed housing activity to a near halt.

“The pandemic has fundamentally changed what a lot of buyers are looking for in a home,” said Redfin economist Taylor Marr. “People are spending more time at home and less time at the office or school, and that means buyers want more space and private yards. And because of concerns about the virus, they aren’t as interested in shared amenities like elevators, community pools and gyms, which have traditionally been benefits of condo living. But condos tend to be more affordable than single-family homes, especially now with historically low mortgage rates and the fact that condo prices are down from last year while they’re up for single-family homes. Those factors are motivating some buyers to jump back into the condo market, particularly those who have found that purchasing a condo is just as affordable as renting an apartment.”

Market Summary, June 2020
CondosSingle-family homes
Median sale price$252,000$322,000
Median sale price, YoY-1.4%2.6%
Homes sold, seasonally adjusted, YoY-31.3%-11.9%
Pending sales, seasonally adjusted, YoY-4%6.1%
New listings, seasonally adjusted, YoY1.9%-13.5%
All homes for sale, seasonally adjusted, YoY-6.7%-24.1%
Median days on market4339
Months of supply3.11.9
Sold above list18.3%27.5%

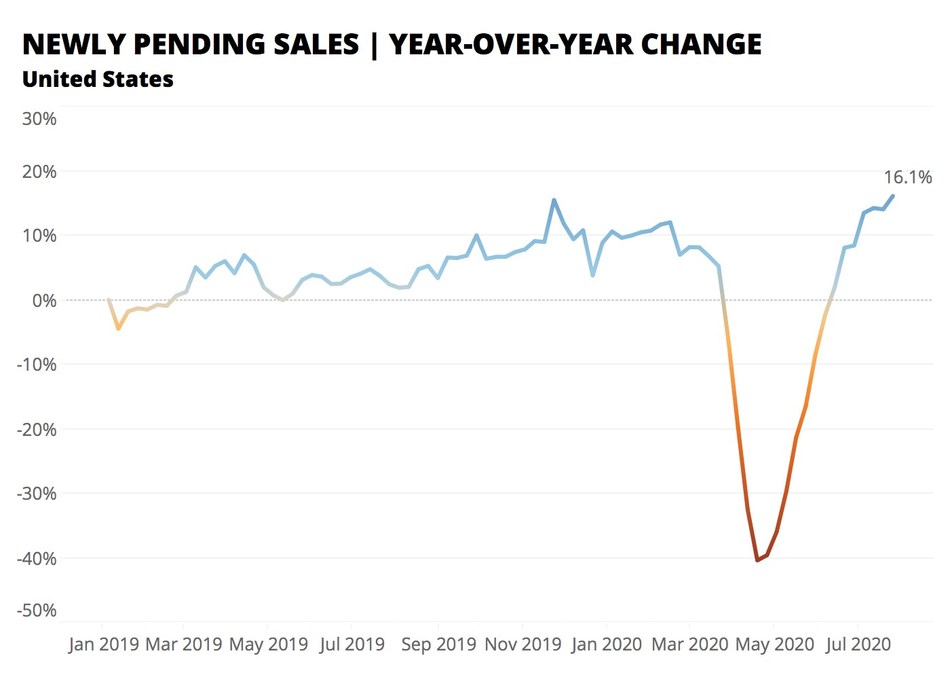
Condo sales were down in June, but pending sales indicate buyers are coming back
Condo sales fell 31.3% year over year in June on a seasonally adjusted basis, following a 53.5% drop in May when sales growth bottomed out. Single-family home sales are experiencing smaller drops, with an 11.9% year-over-year decline in June after a 27.6% drop at their low point in May.

Pending condo sales were down 4% year over year on a seasonally adjusted basis in June, an uptick from the 46.1% drop when growth bottomed out in April. The recovery in pending sales indicates that demand for condos is returning, albeit less so than for single-family homes, which posted a 6.1% year-over-year increase in June, up from a 28.3% decline at their low point in April.

Condo supply recovered to near pre-pandemic levels, but it’s still down compared with last year
The number of condos for sale fell 6.7% year over year in June on a seasonally adjusted basis, close to the 5% drop before the pandemic in February. It bottomed out in April with a 22.6% annual drop. New condo listings rose 1.9% year over year in June after bottoming out with a 47.1% fall in April.

The number of single-family homes for sale continued to drop in June, down 24.1% year over year. New listings of single-family homes dipped 13.5% year over year, versus a 38.9% drop when they bottomed out in April.

“Right now we have a mixed bag of buyers. Condo buyers are more hesitant and taking longer to make decisions than people who are looking at single-family homes,” said San Francisco Redfin agent Carlos Barrientos. “People who want a condo are less confident that the space will be comfortable to live and work long-term, and they’re worried about the investment. The people who are going through with condo purchases are doing it because that’s what they can afford.”

There’s competition for condos—but there’s more for single-family homes
Just over 41% of condos went off the market in two weeks in June, up from 35.5% a year before and more than any month since February 2018. Nearly 47% of single-family homes went off the market in two weeks in June, up from 38.1% in June 2019 and the highest share in at least eight years.

Just over 40% of Redfin offers for condos faced competition in June, while more than 56% of single-family homes were part of bidding wars.

“Condos aren’t flying off the shelves like single-family homes, but I’ve helped buyers with several recent condo deals,” said Tony Orlando, a Redfin agent in Detroit. “Because condos tend to be more affordable, they still appeal to people looking for less expensive homes and they’re often attractive to first-time homebuyers, people who live alone and buyers looking to downsize and have a maintenance-free lifestyle.”

To read the full report, including charts and a metro-level data breakout, please visit: https://www.redfin.com/blog/condo-prices-down-buyer-interest-increases.

About Redfin
Redfin (www.redfin.com) is a technology-powered residential real estate company, redefining real estate in the consumer’s favor in a commission-driven industry. We do this by integrating every step of the home buying and selling process and pairing our own agents with our own technology, creating a service that is faster, better and costs less. We offer brokerage, iBuying, mortgage, and title services, and we also run the country’s #1 real estate brokerage search site, offering a host of online tools to consumers, including the Redfin Estimate. We represent people buying and selling homes in over 90 markets in the United States and Canada. Since our launch in 2006, we have saved our customers over $800 million and we’ve helped them buy or sell more than 235,000 homes worth more than $115 billion.

For more information or to contact a local Redfin real estate agent, visit www.redfin.com. To learn about housing market trends and download data, visit the Redfin Data Center. To be added to Redfin’s press release distribution list, email press@redfin.com. To view Redfin’s press center, click here.

SOURCE Redfin

Pace of Home Sales Trending Well Ahead of Last Year

This Zillow Weekly Market Report includes housing market data as of the week ending July 25

Seattle, WA – July 31, 2020 (PRNewswire) Homes shifting from for-sale to pending, a leading indicator of completed sales, are 16.1% higher than last year, Zillow’s Weekly Market Reporti shows. New listings are not keeping pace with buyer demand, causing homes to typically sell after only two weeks on the market — a record pace in Zillow data that dates back to the start of 2019.

Newly pending sales are slowing as we enter the last summer month, but market pace remains well ahead of last year

(PRNewsfoto/Zillow)
  • Newly pending sales are down 1.4% month over month due to seasonal trends, but are up 16.1% year over year and are continuing to post accelerating growthii
  • Homes that went under contract last week typically were plucked off the market after just 14 days, one day faster than the previous week and nine days faster than last year.

Sellers continue to remain largely on the sidelines

  • New for-sale listings fell 2.2% from last week, and are now down 12.2% year over year. 
  • Total inventory continues to fall without an influx of new listings. Total inventory fell 0.9% from the previous week, and is now down 26.3% year over year.

Prices continue on steady climb

  • List prices have been steadily rising throughout 2020, up 0.3% week over week to $342,660. That’s 6% higher than a year ago. 
  • The median sale price the week ending June 13 was $263,819, 0.5% higher than the previous week and up 0.7% year over year. 
  • 4.2% of listings last week had cut their price, the same share as the week prior and 1.3 percentage points less than a year ago. 
Metropolitan
Area*
Newly
Pending
Sales –
YoY
Newly
Pending
Sales –
WoW
Median
Days to
Pending
New
For-
Sale
Listings
-YoY
New
For-
Sale
Listings
– WoW
Total
For-
Sale
Listings
– YoY
Median
Sale
Price**
Median
Sale
Price –
YoY**
United States16.1%-0.6%14-12.2%-2.2%-26.3%$263,8190.7%
New York, NYN/A3.5%2812.7%1.3%-20.6%$427,0404.1%
Los Angeles-
Long Beach-
Anaheim, CA
2.1%2.0%14-7.0%-0.6%-27.4%$663,0001.7%
Chicago, IL37.0%0.6%14-3.5%-2.7%-24.8%$249,6000.0%
Dallas-Fort
Worth, TX
22.3%-3.2%24-19.8%-5.1%-23.0%$284,1500.8%
Philadelphia, PAN/A-1.5%98.9%4.5%-35.4%$259,4900.6%
Houston, TXN/A-0.4%18-12.9%-3.7%-21.5%$249,7280.2%
Washington, DCN/A2.8%70.3%2.6%-34.4%$427,2460.0%
Miami-Fort
Lauderdale,
FL
N/A-0.7%31-4.5%2.3%-10.8%$316,5508.9%
Atlanta, GA13.7%-4.0%16-21.1%0.1%-17.2%$263,4530.4%
Boston, MA17.5%-0.7%8-13.8%-13.8%-24.2%$495,3903.6%
San Francisco,
CA
N/A5.0%1215.7%1.9%-8.7%$851,000-1.6%
Detroit, MIN/A-0.5%8-11.4%-3.1%-29.3%$201,830-1.8%
Riverside, CA13.7%-0.6%12-9.9%-3.0%-42.1%$386,1842.8%
Phoenix, AZN/A-2.1%141.0%-0.7%-28.2%$303,3144.2%
Seattle, WAN/A3.5%6-10.4%-3.8%-37.5%$512,2470.6%
Minneapolis-
St Paul, MN
N/A-0.5%18-18.9%-4.9%-23.4%$293,8502.9%
San Diego, CAN/A4.1%8-7.4%1.7%-37.4%$598,6502.4%
St. Louis, MO13.5%0.8%7-10.7%1.4%-29.0%$203,9802.4%
Tampa, FLN/AN/A11-8.8%2.7%-29.6%$243,5766.3%
Baltimore, MD12.6%-0.7%11-15.0%-1.0%-42.0%$301,100-0.7%
Denver, CO18.9%-0.6%71.2%-6.8%-26.3%$435,8720.7%
Pittsburgh, PAN/A-1.2%8-13.6%-12.0%-25.2%$180,080-2.4%
Portland, OR15.3%1.9%6-6.3%4.9%-29.7%$416,1981.6%
Charlotte, NC-8.2%-2.0%7-26.7%-0.8%-37.2%$263,039-2.3%
Sacramento,
CA
16.8%-2.5%9-3.8%-4.4%-33.4%$435,4002.3%
San Antonio,
TX
N/A-0.8%26-25.1%-5.9%-19.8%$244,8603.0%
Orlando, FLN/AN/A12-10.2%0.4%-15.5%$268,5803.4%
Cincinnati, OH4.4%-2.0%4-25.8%-3.9%-35.5%$202,6406.4%
Cleveland, OH24.1%0.9%15-13.7%-0.5%-36.7%$166,4302.0%
Kansas City,
MO
N/A-3.2%5-20.5%-8.3%-37.8%$242,9322.7%
Las Vegas, NVN/A-1.4%20-3.6%0.9%-26.9%$302,3492.4%
Columbus,
OH
4.1%-1.2%4-27.2%-0.5%-33.9%$223,1202.2%
Indianapolis,
IN
N/A-1.1%4-14.6%-1.3%-35.8%$212,7007.6%
San Jose, CAN/A-3.4%1622.0%-13.0%-25.9%$1,116,5801.2%
Austin, TXN/A-1.8%8-22.3%-6.1%-25.6%$337,5451.8%
Virginia
Beach, VA
N/A5.1%370.6%-0.5%-35.0%$265,0951.0%
Nashville, TNN/AN/A34-28.4%-0.3%-12.4%$305,9951.8%
Providence,
RI
N/A-0.3%12-0.9%-4.8%-32.4%$304,4002.9%
Milwaukee,
WI
N/AN/A282.8%10.5%-11.3%$245,8603.0%
Jacksonville,
FL
24.2%1.3%16-3.9%0.3%-27.9%$254,2091.7%
Memphis, TNN/A1.1%6-22.6%-6.9%-36.5%$199,4801.8%
Oklahoma
City, OK
N/A0.7%9-14.1%-3.9%-27.0%$196,9942.8%
Louisville, KYN/A0.7%6-22.6%-6.9%-37.7%$203,6601.9%
Hartford, CT40.3%1.6%9-10.8%-13.2%-39.6%$236,6500.2%
Richmond, VAN/AN/A6-25.3%-8.1%-30.2%$273,5003.8%
New Orleans,
LA
32.9%0.2%17-13.3%-4.6%-34.6%$223,1545.4%
Buffalo, NY12.2%0.4%913.0%4.1%-29.3%$174,2994.1%
Raleigh, NCN/A-2.6%5-9.9%-8.1%-31.7%$298,3500.5%
Birmingham,
AL
30.8%-1.2%8-15.2%-9.4%-30.8%$220,3620.4%
Salt Lake City,
UT
N/AN/A7-20.0%7.5%-36.9%$357,9304.5%
*Table ordered by market size 
**As of the week ending June 13

About Zillow
Zillow, the top real estate website in the U.S., is building an on-demand real estate experience. Whether selling, buying, renting or financing, customers can turn to Zillow’s businesses to find and get into their next home with speed, certainty and ease.

In addition to for-sale and rental listings, Zillow Offers buys and sells homes directly in dozens of markets across the country, allowing sellers control over their timeline. Zillow Home Loans, our affiliate lender, provides our customers with an easy option to get pre-approved and secure financing for their next home purchase.

Millions of people visit Zillow Group sites every month to start their home search, and now they can rely on Zillow to help them finish it — with the same confidence, ease and empowerment they’ve come to expect from real estate’s most trusted brand.

Zillow is owned and operated by Zillow Group, Inc. (NASDAQ: Z and ZG).

i The Zillow Weekly Market Reports are a weekly overview of the national and local real estate markets. The reports are compiled by Zillow Economic Research and data is aggregated from public sources and listing data on Zillow.com. New for-sale listings data reflect daily counts using a smoothed, seven-day trailing average. Total for-sale listings, newly pending sales, days to pending and median list price data reflect weekly counts using a smoothed, four-week trailing average. For more information, visit www.zillow.com/research/.
ii National newly pending sales trends are based upon aggregation of the 38 largest metro areas where historic pending listing data coverage is most statistically reliable, and excludes some metros due to upstream data coverage issues.

SOURCE Zillow