New York, NY – May 28, 2019 (PRNewswire) S&P Dow Jones Indices today released the latest results for the S&P CoreLogic Case-Shiller Indices, the leading measure of U.S. home prices. Data released today for March 2019 shows that the rate of home price increases across the U.S. has continued to slow. More than 27 years of history for these data series is available, and can be accessed in full by going to www.homeprice.spdji.com. Additional content on the housing market can also be found on S&P Dow Jones Indices’ housing blog: www.housingviews.com.
YEAR-OVER-YEAR
The S&P CoreLogic Case-Shiller U.S. National Home Price NSA Index, covering all nine U.S. census divisions, reported a 3.7% annual gain in March, down from 3.9% in the previous month. The 10-City Composite annual increase came in at 2.3%, down from 2.5% in the previous month. The 20-City Composite posted a 2.7% year-over-year gain, down from 3.0% in the previous month.
Las Vegas, Phoenix and Tampa reported the highest year-over-year gains among the 20 cities. In March, Las Vegas led the way with an 8.2% year-over-year price increase, followed by Phoenix with a 6.1% increase, and Tampa with a 5.3% increase. Four of the 20 cities reported greater price increases in the year ending March 2019 versus the year ending February 2019.
MONTH-OVER-MONTH
Before seasonal adjustment, the National Index posted a month-over-month increase of 0.6% in March. The 10-City and 20-City Composites both reported 0.7% increases for the month. After seasonal adjustment, the National Index recorded a 0.3% month-over-month increase in March. The 10-City and 20-City Composites both posted 0.1% month-over-month increases. In March, 19 of 20 cities reported increases before seasonal adjustment, while 14 of 20 cities reported increases after seasonal adjustment.
ANALYSIS
“Home price gains continue to slow,” says David M. Blitzer, Managing Director and Chairman of the Index Committee at S&P Dow Jones Indices. “The patterns seen in the last year or more continue: year-over-year price gains in most cities are consistently shrinking. Double-digit annual gains have vanished. The largest annual gain was 8.2% in Las Vegas; one year ago, Seattle had a 13% gain. In this report, Seattle prices are up only 1.6%. The 20-City Composite dropped from 6.7% to 2.7% annual gains over the last year as well. The shift to smaller price increases is broad-based and not limited to one or two cities where large price increases collapsed. Other housing statistics tell a similar story. Existing single family home sales are flat. Since 2017, peak sales were in February 2018 at 5.1 million at annual rates; the weakest were 4.36 million in January 2019. The range was 650,000.
“Given the broader economic picture, housing should be doing better. Mortgage rates are at 4% for a 30-year fixed rate loan, unemployment is close to a 50-year low, low inflation and moderate increases in real incomes would be expected to support a strong housing market. Measures of household debt service do not reveal any problems and consumer sentiment surveys are upbeat. The difficulty facing housing may be too-high price increases. At the currently lower pace of home price increases, prices are rising almost twice as fast as inflation: in the last 12 months, the S&P Corelogic Case-Shiller National Index is up 3.7%, double the 1.9% inflation rate. Measured in real, inflation-adjusted terms, home prices today are rising at a 1.8% annual rate. This compares to a 1.2% real annual price increases in housing since 1975.”
SUPPORTING DATA
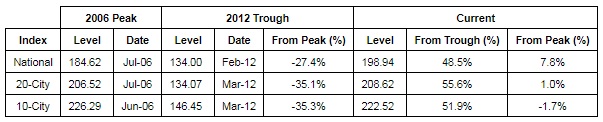
Table 1 below shows the housing boom/bust peaks and troughs for the three composites along with the current levels and percentage changes from the peaks and troughs.
| 2006 Peak | 2012 Trough | Current | ||||||
| Index | Level | Date | Level | Date | From Peak (%) | Level | From Trough (%) | From Peak (%) |
| National | 184.62 | Jul-06 | 134.00 | Feb-12 | -27.4% | 206.23 | 53.9% | 11.7% |
| 20-City | 206.52 | Jul-06 | 134.07 | Mar-12 | -35.1% | 214.09 | 59.7% | 3.7% |
| 10-City | 226.29 | Jun-06 | 146.45 | Mar-12 | -35.3% | 227.57 | 55.4% | 0.6% |
Table 2 below summarizes the results for March 2019. The S&P CoreLogic Case-Shiller Indices are revised for the prior 24 months, based on the receipt of additional source data.
| March 2019 | March/February | February/January | 1-Year | |
| Metropolitan Area | Level | Change (%) | Change (%) | Change (%) |
| Atlanta | 149.89 | 0.7% | 0.3% | 4.7% |
| Boston | 216.91 | 1.6% | -0.4% | 3.8% |
| Charlotte | 160.66 | 0.8% | -0.1% | 4.0% |
| Chicago | 142.61 | 0.6% | 0.0% | 1.8% |
| Cleveland | 122.28 | 0.9% | -0.3% | 3.5% |
| Dallas | 189.04 | 0.3% | 0.2% | 3.0% |
| Denver | 219.76 | 1.0% | 0.9% | 4.3% |
| Detroit | 123.83 | 0.4% | 0.1% | 3.3% |
| Las Vegas | 190.35 | 0.1% | 0.3% | 8.2% |
| Los Angeles | 281.63 | 0.5% | 0.0% | 1.3% |
| Miami | 242.01 | 0.6% | 0.1% | 4.3% |
| Minneapolis | 172.58 | 1.1% | -0.4% | 3.7% |
| New York | 201.46 | -0.1% | 0.0% | 2.3% |
| Phoenix | 188.20 | 0.4% | 0.1% | 6.1% |
| Portland | 233.19 | 0.7% | 0.1% | 2.6% |
| San Diego | 256.63 | 1.2% | 1.0% | 1.3% |
| San Francisco | 265.09 | 2.1% | 0.6% | 1.4% |
| Seattle | 248.99 | 1.6% | 0.6% | 1.6% |
| Tampa | 216.76 | 0.5% | 0.7% | 5.3% |
| Washington | 229.82 | 0.9% | 0.3% | 2.8% |
| Composite-10 | 227.57 | 0.7% | 0.2% | 2.3% |
| Composite-20 | 214.09 | 0.7% | 0.2% | 2.7% |
| U.S. National | 206.23 | 0.6% | 0.2% | 3.7% |
| Sources: S&P Dow Jones Indices and CoreLogic | ||||
| Data through March 2019 |
Table 3 below shows a summary of the monthly changes using the seasonally adjusted (SA) and non-seasonally adjusted (NSA) data. Since its launch in early 2006, the S&P CoreLogic Case-Shiller Indices have published, and the markets have followed and reported on, the non-seasonally adjusted data set used in the headline indices. For analytical purposes, S&P Dow Jones Indices publishes a seasonally adjusted data set covered in the headline indices, as well as for the 17 of 20 markets with tiered price indices and the five condo markets that are tracked.
| March/February Change (%) | February/January Change (%) | |||
| Metropolitan Area | NSA | SA | NSA | SA |
| Atlanta | 0.7% | 0.1% | 0.3% | 0.2% |
| Boston | 1.6% | 1.1% | -0.4% | -0.2% |
| Charlotte | 0.8% | 0.1% | -0.1% | 0.0% |
| Chicago | 0.6% | -0.2% | 0.0% | 0.3% |
| Cleveland | 0.9% | 0.6% | -0.3% | 0.5% |
| Dallas | 0.3% | -0.1% | 0.2% | 0.0% |
| Denver | 1.0% | 0.3% | 0.9% | 0.7% |
| Detroit | 0.4% | 0.0% | 0.1% | 0.2% |
| Las Vegas | 0.1% | 0.0% | 0.3% | 0.4% |
| Los Angeles | 0.5% | -0.1% | 0.0% | 0.0% |
| Miami | 0.6% | 0.4% | 0.1% | 0.3% |
| Minneapolis | 1.1% | 0.5% | -0.4% | 0.1% |
| New York | -0.1% | 0.1% | 0.0% | 0.3% |
| Phoenix | 0.4% | 0.3% | 0.1% | 0.2% |
| Portland | 0.7% | 0.2% | 0.1% | 0.1% |
| San Diego | 1.2% | 0.7% | 1.0% | 0.5% |
| San Francisco | 2.1% | 0.7% | 0.6% | 0.2% |
| Seattle | 1.6% | 0.0% | 0.6% | 0.1% |
| Tampa | 0.5% | 0.5% | 0.7% | 0.7% |
| Washington | 0.9% | 0.4% | 0.3% | 0.4% |
| Composite-10 | 0.7% | 0.1% | 0.2% | 0.2% |
| Composite-20 | 0.7% | 0.1% | 0.2% | 0.3% |
| U.S. National | 0.6% | 0.3% | 0.2% | 0.3% |
| Sources: S&P Dow Jones Indices and CoreLogic | ||||
| Data through March 2019 |
For more information about S&P Dow Jones Indices, please visit www.spdji.com.
ABOUT S&P DOW JONES INDICES
S&P Dow Jones Indices is the largest global resource for essential index-based concepts, data and research, and home to iconic financial market indicators, such as the S&P 500® and the Dow Jones Industrial Average®. More assets are invested in products based on our indices than products based on indices from any other provider in the world. Since Charles Dow invented the first index in 1884, S&P DJI has become home to over 1,000,000 indices across the spectrum of asset classes that have helped define the way investors measure and trade the markets.
S&P Dow Jones Indices is a division of S&P Global (NYSE: SPGI), which provides essential intelligence for individuals, companies, and governments to make decisions with confidence. For more information, visit www.spdji.com.
FOR MORE INFORMATION:
David Blitzer
Managing Director and Chairman of Index Committee
New York, USA
(+1) 212 438 3907
david.blitzer@spglobal.com
April Kabahar
Global Head of Communications
New York, USA
(+1) 212 438 7530
april.kabahar@spglobal.com
S&P Dow Jones Indices’ interactive blog, HousingViews.com, delivers real-time commentary and analysis from industry experts across S&P Global on a wide-range of topics impacting residential home prices, homebuilding and mortgage financing in the United States. Readers and viewers can visit the blog at www.housingviews.com, where feedback and commentary are welcomed and encouraged.
The S&P CoreLogic Case-Shiller Indices are published on the last Tuesday of each month at 9:00 am ET. They are constructed to accurately track the price path of typical single-family homes located in each metropolitan area provided. Each index combines matched price pairs for thousands of individual houses from the available universe of arms-length sales data. The S&P CoreLogic Case-Shiller U.S. National Home Price Index tracks the value of single-family housing within the United States. The index is a composite of single-family home price indices for the nine U.S. Census divisions and is calculated quarterly. The S&P CoreLogic Case-Shiller 10-City Composite Home Price Index is a value-weighted average of the 10 original metro area indices. The S&P CoreLogic Case-Shiller 20-City Composite Home Price Index is a value-weighted average of the 20 metro area indices. The indices have a base value of 100 in January 2000; thus, for example, a current index value of 150 translates to a 50% appreciation rate since January 2000 for a typical home located within the subject market.
These indices are generated and published under agreements between S&P Dow Jones Indices and CoreLogic, Inc.
The S&P CoreLogic Case-Shiller Indices are produced by CoreLogic, Inc. In addition to the S&P CoreLogic Case-Shiller Indices, CoreLogic also offers home price index sets covering thousands of zip codes, counties, metro areas, and state markets. The indices, published by S&P Dow Jones Indices, represent just a small subset of the broader data available through CoreLogic.
Case-Shiller® and CoreLogic® are trademarks of CoreLogic Case-Shiller, LLC or its affiliates or subsidiaries (“CoreLogic”) and have been licensed for use by S&P Dow Jones Indices. None of the financial products based on indices produced by CoreLogic or its predecessors in interest are sponsored, sold, or promoted by CoreLogic, and neither CoreLogic nor any of its affiliates, subsidiaries, or predecessors in interest makes any representation regarding the advisability of investing in such products.