New York, NY – March 27, 2018 (PRNewswire) S&P Dow Jones Indices today released the latest results for the S&P CoreLogic Case-Shiller Indices, the leading measure of U.S. home prices. Data released today for January 2018 shows that home prices continued their rise across the country over the last 12 months. More than 27 years of history for these data series is available, and can be accessed in full by going to www.homeprice.spdji.com. Additional content on the housing market can also be found on S&P Dow Jones Indices’ housing blog: www.housingviews.com.
![]()
YEAR-OVER-YEAR
The S&P CoreLogic Case-Shiller U.S. National Home Price NSA Index, covering all nine U.S. census divisions, reported a 6.2% annual gain in January, down from 6.3% in the previous month. The 10-City Composite annual increase came in at 6.0%, no change from the previous month. The 20-City Composite posted a 6.4% year-over-year gain, up from 6.3% in the previous month.
Seattle, Las Vegas, and San Francisco reported the highest year-over-year gains among the 20 cities. In January, Seattle led the way with a 12.9% year-over-year price increase, followed by Las Vegas with an 11.1% increase and San Francisco with a 10.2% increase. Twelve of the 20 cities reported greater price increases in the year ending January 2018 versus the year ending December 2017.
The charts on the following page compare year-over-year returns of different housing price ranges (tiers) for the top two cities, Seattle and Las Vegas.
MONTH-OVER-MONTH
Before seasonal adjustment, the National Index posted a month-over-month gain of 0.05% in January. The 10-City and 20-City Composites both reported increases of 0.3%. After seasonal adjustment, the National Index recorded a 0.5% month-over-month increase in January. The 10-City and 20-City Composites posted 0.7% and 0.8% month-over-month increases, respectively. Sixteen of the 20 cities reported increases in January before seasonal adjustment, while all 20 cities reported increases after seasonal adjustment.
ANALYSIS
“The home price surge continues,” says David M. Blitzer, Managing Director and Chairman of the Index Committee at S&P Dow Jones Indices. “Since the market bottom in December 2012, the S&P CoreLogic Case-Shiller National Home Price index has climbed at a 4.7% real – inflation adjusted – annual rate. That is twice the rate of economic growth as measured by the GDP. While price gains vary from city to city, there are few, if any, really weak spots. Seattle, up 12.9% in the last year, continues to see the largest gains, followed by Las Vegas up 11.1% over the same period. Even Chicago and Washington, the cities with the smallest price gains, saw a 2.4% annual increase in home prices.
“Two factors supporting price increases are the low inventory of homes for sale and the low vacancy rate among owner-occupied housing. The current months-supply — how many months at the current sales rate would be needed to absorb homes currently for sale — is 3.4; the average since 2000 is 6.0 months, and the high in July 2010 was 11.9. Currently, the homeowner vacancy rate is 1.6% compared to an average of 2.1% since 2000; it peaked in 2010 at 2.7%. Despite limited supplies, rising prices, and higher mortgage rates, affordability is not a concern. Affordability measures published by the National Association of Realtors show that a family with a median income could comfortably afford a mortgage for a median priced home.”
SUPPORTING DATA
Table 1 below shows the housing boom/bust peaks and troughs for the three composites along with the current levels and percentage changes from the peaks and troughs.
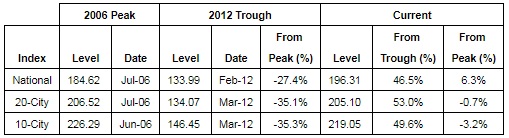
Table 2 below summarizes the results for January 2018. The S&P CoreLogic Case-Shiller Indices are revised for the prior 24 months, based on the receipt of additional source data.

Table 3 below shows a summary of the monthly changes using the seasonally adjusted (SA) and non-seasonally adjusted (NSA) data. Since its launch in early 2006, the S&P CoreLogic Case-Shiller Indices have published, and the markets have followed and reported on, the non-seasonally adjusted data set used in the headline indices. For analytical purposes, S&P Dow Jones Indices publishes a seasonally adjusted data set covered in the headline indices, as well as for the 17 of 20 markets with tiered price indices and the five condo markets that are tracked.

For more information about S&P Dow Jones Indices, please visit www.spdji.com.
ABOUT S&P DOW JONES INDICES
S&P Dow Jones Indices is the largest global resource for essential index-based concepts, data and research, and home to iconic financial market indicators, such as the S&P 500® and the Dow Jones Industrial Average®. More assets are invested in products based on our indices than products based on indices from any other provider in the world. Since Charles Dow invented the first index in 1884, S&P DJI has become home to over 1,000,000 indices across the spectrum of asset classes that have helped define the way investors measure and trade the markets.
S&P Dow Jones Indices is a division of S&P Global (NYSE: SPGI), which provides essential intelligence for individuals, companies, and governments to make decisions with confidence. For more information, visit www.spdji.com.
FOR MORE INFORMATION:
David Blitzer
Managing Director and Chairman of Index Committee
New York, USA
(+1) 212 438 3907
david.blitzer@spglobal.com
Soogyung Jordan
Global Head of Communications
New York, USA
(+1) 212 438 2297
soogyung.jordan@spglobal.com
Luke Shane
North America Communications
New York, USA
(+1) 212 438 8184
luke.shane@spglobal.com
S&P Dow Jones Indices’ interactive blog, HousingViews.com, delivers real-time commentary and analysis from industry experts across S&P Global on a wide-range of topics impacting residential home prices, homebuilding and mortgage financing in the United States. Readers and viewers can visit the blog at www.housingviews.com, where feedback and commentary is welcomed and encouraged.
The S&P CoreLogic Case-Shiller Indices are published on the last Tuesday of each month at 9:00 am ET. They are constructed to accurately track the price path of typical single-family homes located in each metropolitan area provided. Each index combines matched price pairs for thousands of individual houses from the available universe of arms-length sales data. The S&P CoreLogic Case-Shiller U.S. National Home Price Index tracks the value of single-family housing within the United States. The index is a composite of single-family home price indices for the nine U.S. Census divisions and is calculated quarterly. The S&P CoreLogic Case-Shiller 10-City Composite Home Price Index is a value-weighted average of the 10 original metro area indices. The S&P CoreLogic Case-Shiller 20-City Composite Home Price Index is a value-weighted average of the 20 metro area indices. The indices have a base value of 100 in January 2000; thus, for example, a current index value of 150 translates to a 50% appreciation rate since January 2000 for a typical home located within the subject market.
These indices are generated and published under agreements between S&P Dow Jones Indices and CoreLogic, Inc.
The S&P CoreLogic Case-Shiller Indices are produced by CoreLogic, Inc. In addition to the S&P CoreLogic Case-Shiller Indices, CoreLogic also offers home price index sets covering thousands of zip codes, counties, metro areas, and state markets. The indices, published by S&P Dow Jones Indices, represent just a small subset of the broader data available through CoreLogic.
Case-Shiller® and CoreLogic® are trademarks of CoreLogic Case-Shiller, LLC or its affiliates or subsidiaries (“CoreLogic”) and have been licensed for use by S&P Dow Jones Indices. None of the financial products based on indices produced by CoreLogic or its predecessors in interest are sponsored, sold, or promoted by CoreLogic, and neither CoreLogic nor any of its affiliates, subsidiaries, or predecessors in interest makes any representation regarding the advisability of investing in such products.