National Delinquency Drops Below March 2020 Level for the First Time Since Onset of the Pandemic

Additionally, all stages of delinquency showed year-over-year declines in November 2021

Irvine, CA – February 8th, 2022 (BUSINESS WIRE)–CoreLogic, a leading global property information, analytics and data-enabled solutions provider, today released its monthly Loan Performance Insights Report for November 2021.

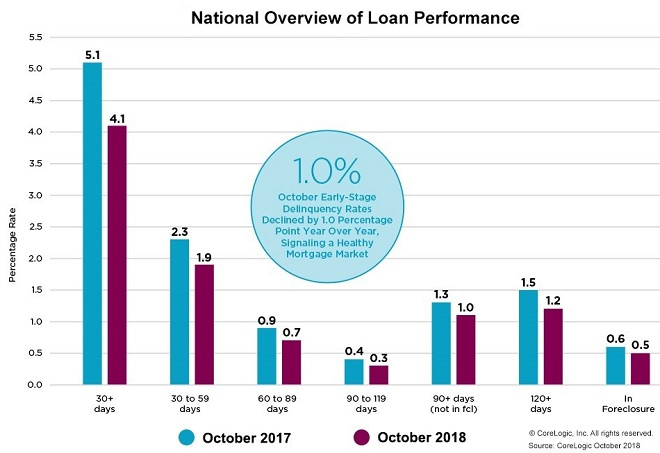
For the month of November, 3.6% of all mortgages in the U.S. were in some stage of delinquency (30 days or more past due, including those in foreclosure), representing a 2.3-percentage point decrease compared to November 2020, when it was 5.9%.

To gain a complete view of the mortgage market and loan performance health, CoreLogic examines all stages of delinquency. In November 2021, the U.S. delinquency and transition rates, and their year-over-year changes, were as follows:

  • Early-Stage Delinquencies (30 to 59 days past due): 1.2%, down from 1.4% in November 2020.
  • Adverse Delinquency (60 to 89 days past due): 0.3%, down from 0.6% in November 2020.
  • Serious Delinquency (90 days or more past due, including loans in foreclosure): 2%, down from 3.9% in November 2020 and a high of 4.3% in August 2020.
  • Foreclosure Inventory Rate (the share of mortgages in some stage of the foreclosure process): 0.2%, down from 0.3% in November 2020. This remains the lowest foreclosure rate recorded since 1999.
  • Transition Rate (the share of mortgages that transitioned from current to 30 days past due): 0.6%, down from 0.8% in November 2020.
CoreLogic National Overview of Mortgage Loan Performance, featuring November 2021 Data (Graphic: Business Wire)
CoreLogic Change in Overall Delinquency Rate for Select States, featuring November 2021 Data (Graphic: Business Wire)
CoreLogic Foreclosure and Delinquency Rates for Select Metropolitan Areas, featuring November 2021 Data (Graphic: Business Wire)

For the first time since the onset of the pandemic, national overall delinquency dropped below the March 2020 level of 3.6%, a sign that mortgage performance is following the nation’s income growth. At the same time, foreclosure rates remain at historic lows as borrowers have been able to lean into the equity generated by a year of record-breaking home price growth. These factors combined have helped borrowers weather the lasting economic impacts brought on by the pandemic and avoid falling behind on payments or losing their homes.

“Nonfarm employment rose 6.45 million during 2021, helping to rebuild income for families under financial stress during the pandemic,” said Dr. Frank Nothaft, chief economist at CoreLogic. “Income growth has helped to reduce past-due rates and home equity build-up has reduced the likelihood of a distressed sale for families that experience financial challenges.”

State and Metro Takeaways:

  • In November 2021, all states logged year over year declines in their overall delinquency rate. The states with the largest declines were: Nevada (down 3.8 percentage points); New Jersey (down 3.6 percentage points); Hawaii (down 3.5 percentage points); Florida (down 3.4 percentage points); and New York (down 3.2 percentage points).
  • All except one U.S. metropolitan area posted at least a small annual decrease in their overall delinquency rate. The one area with an annual increase in November 2021 was Houma-Thibodaux, Louisiana (up 0.4 percentage points). Houma was impacted by Hurricane Ida in the fall, but its November delinquency rate is an improvement from October as the area works to recover.

The next CoreLogic Loan Performance Insights Report will be released on March 8, 2022, featuring data for December 2021. For ongoing housing trends and data, visit the CoreLogic Intelligence Blog: www.corelogic.com/intelligence.

Methodology

The data in The CoreLogic LPI report represents foreclosure and delinquency activity reported through November 2021. The data in this report accounts for only first liens against a property and does not include secondary liens. The delinquency, transition and foreclosure rates are measured only against homes that have an outstanding mortgage. Homes without mortgage liens are not subject to foreclosure and are, therefore, excluded from the analysis. CoreLogic has approximately 75% coverage of U.S. foreclosure data.

Source: CoreLogic

The data provided is for use only by the primary recipient or the primary recipient’s publication or broadcast. This data may not be re-sold, republished or licensed to any other source, including publications and sources owned by the primary recipient’s parent company without prior written permission from CoreLogic. Any CoreLogic data used for publication or broadcast, in whole or in part, must be sourced as coming from CoreLogic, a data and analytics company. For use with broadcast or web content, the citation must directly accompany first reference of the data. If the data is illustrated with maps, charts, graphs or other visual elements, the CoreLogic logo must be included on screen or website. For questions, analysis or interpretation of the data, contact Robin Wachner at newsmedia@corelogic.com. Data provided may not be modified without the prior written permission of CoreLogic. Do not use the data in any unlawful manner. This data is compiled from public records, contributory databases and proprietary analytics, and its accuracy is dependent upon these sources.

About CoreLogic

CoreLogic is a leading global property information, analytics and data-enabled solutions provider. The company’s combined data from public, contributory and proprietary sources includes over 4.5 billion records spanning more than 50 years, providing detailed coverage of property, mortgages and other encumbrances, consumer credit, tenancy, location, hazard risk and related performance information. The markets CoreLogic serves include real estate and mortgage finance, insurance, capital markets, and the public sector. CoreLogic delivers value to clients through unique data, analytics, workflow technology, advisory and managed services. Clients rely on CoreLogic to help identify and manage growth opportunities, improve performance and mitigate risk. Headquartered in Irvine, Calif., CoreLogic operates in North America, Western Europe and Asia Pacific. For more information, please visit www.corelogic.com.

CORELOGIC and the CoreLogic logo are trademarks of CoreLogic, Inc. and/or its subsidiaries. All other trademarks are the property of their respective owners.

Contacts

Robin Wachner
CoreLogic
newsmedia@corelogic.com

CoreLogic Loan Performance Insights Find Delinquency Rates in October Dropped to the Lowest Level in at Least 18 Years

  • U.S. serious delinquency rate was the lowest since November 2006
  • Total past due and serious delinquency rates were down annually in October in all states except North Dakota, where the rates remained unchanged
  • Some hurricane-affected metros in the Carolinas and Florida Panhandle suffer jumps in key delinquency rates

Irvine, CA – January 8, 2019 (BUSINESS WIRE) CoreLogic® (NYSE: CLGX), a leading global property information, analytics and data-enabled solutions provider, today released its monthly Loan Performance Insights Report. The report shows that, nationally, 4.1 percent of mortgages were in some stage of delinquency (30 days or more past due, including those in foreclosure) in October 2018, representing a 1 percentage point decline in the overall delinquency rate compared with October 2017, when it was 5.1 percent. This was the lowest for the month of October in at least 18 years.

CoreLogic Logo

As of October 2018, the foreclosure inventory rate – which measures the share of mortgages in some stage of the foreclosure process – was 0.5 percent, down 0.1 percentage point since October 2017. The October 2018 foreclosure inventory rate tied with the April, May, June, July, August and September rates this year as the lowest for any month since September 2006 and also marked the lowest rate for an October since 2005. In both instances, the foreclosure inventory rate was 0.5 percent.

Measuring early-stage delinquency rates is important for analyzing the health of the mortgage market. To monitor mortgage performance comprehensively, CoreLogic examines all stages of delinquency, as well as transition rates, which indicate the percentage of mortgages moving from one stage of delinquency to the next.

The rate for early-stage delinquencies – defined as 30 to 59 days past due – was 1.9 percent in October 2018, down from 2.3 percent in October 2017. The share of mortgages that were 60 to 89 days past due in October 2018 was 0.7 percent, down from 0.9 percent in October 2017. The serious delinquency rate – defined as 90 days or more past due, including loans in foreclosure – was 1.5 percent in October 2018, down from 1.9 percent in October 2017. This serious delinquency rate was the lowest for an October since 2006 when it was 1.5 percent. It ties August and September 2018 as the lowest for any month since March 2007 when it was also 1.5 percent.

Chart 1

Chart 2

Chart 3

Since early-stage delinquencies can be volatile, CoreLogic also analyzes transition rates. The share of mortgages that transitioned from current to 30 days past due was 0.8 percent in October 2018, down from 1.1 percent in October 2017. By comparison, in January 2007, just before the start of the financial crisis, the current-to-30-day transition rate was 1.2 percent, while it peaked in November 2008 at 2 percent.

“While the strong economy has helped families stay current and push overall delinquency rates lower, areas that were hit hard by natural disasters have seen a rise in loan defaults,” said Dr. Frank Nothaft, chief economist for CoreLogic. “The 30-day delinquency rate in the Panama City, Florida metro area tripled between September and October 2018 as a result of Hurricane Michael. Two months after Hurricane Florence made landfall in the Carolinas, 60-day delinquency rates doubled in the Jacksonville, Wilmington, New Bern and Myrtle Beach metro areas. And buffeted by Kilauea’s eruption in the Hawaiian Islands, serious delinquency rates jumped on the Big Island by 9 percent between June and October 2018, while falling by 4 percent in the rest of Hawaii.”

Hurricane Irma and Hurricane Florence (2017 and 2018, respectively) continue to impact some metropolitan areas, with mortgages transitioning from current to 30 days past due. This October, 18 metropolitan areas posted an annual increase in overall delinquency rate, seven of which were either in North or South Carolina. In the coming months, CoreLogic will continue to monitor these and other metros struck by natural disaster for potential increase in delinquencies.

“Despite some regional spikes related to hurricane and fire impacted areas, overall delinquency rates are near or at historic lows,” said Frank Martell, president and CEO of CoreLogic.

For ongoing housing trends and data, visit the CoreLogic Insights Blog: www.corelogic.com/insights.

Methodology

The data in this report represents foreclosure and delinquency activity reported through October 2018.

The data in this report accounts for only first liens against a property and does not include secondary liens. The delinquency, transition and foreclosure rates are measured only against homes that have an outstanding mortgage. Homes without mortgage liens are not typically subject to foreclosure and are, therefore, excluded from the analysis. Approximately one-third of homes nationally are owned outright and do not have a mortgage. CoreLogic has approximately 85 percent coverage of U.S. foreclosure data.

Source: CoreLogic

The data provided is for use only by the primary recipient or the primary recipient’s publication or broadcast. This data may not be re-sold, republished or licensed to any other source, including publications and sources owned by the primary recipient’s parent company without prior written permission from CoreLogic. Any CoreLogic data used for publication or broadcast, in whole or in part, must be sourced as coming from CoreLogic, a data and analytics company. For use with broadcast or web content, the citation must directly accompany first reference of the data. If the data is illustrated with maps, charts, graphs or other visual elements, the CoreLogic logo must be included on screen or website. For questions, analysis or interpretation of the data, contact Alyson Austin at newsmedia@corelogic.com or Allyse Sanchez at corelogic@ink-co.com. Data provided may not be modified without the prior written permission of CoreLogic. Do not use the data in any unlawful manner. This data is compiled from public records, contributory databases and proprietary analytics, and its accuracy is dependent upon these sources.

About CoreLogic

CoreLogic (NYSE: CLGX) is a leading global property information, analytics and data-enabled solutions provider. The company’s combined data from public, contributory and proprietary sources includes over 4.5 billion records spanning more than 50 years, providing detailed coverage of property, mortgages and other encumbrances, consumer credit, tenancy, location, hazard risk and related performance information. The markets CoreLogic serves include real estate and mortgage finance, insurance, capital markets, and the public sector. CoreLogic delivers value to clients through unique data, analytics, workflow technology, advisory and managed services. Clients rely on CoreLogic to help identify and manage growth opportunities, improve performance and mitigate risk. Headquartered in Irvine, Calif., CoreLogic operates in North America, Western Europe and Asia Pacific. For more information, please visit www.corelogic.com.

CORELOGIC and the CoreLogic logo are trademarks of CoreLogic, Inc. and/or its subsidiaries.

Contacts

Media Contacts:
Alyson Austin
Corporate Communications
949-214-1414
newsmedia@corelogic.com

Allyse Sanchez
INK Communications
925-548-2535
corelogic@ink-co.com


Updated Analysis from CoreLogic Shows 23,044 Homes at High or Extreme Risk Inside Wildfire Perimeters

Reconstruction Cost Value totals more than $8 billion

Irvine, CA – November 16, 2018 (BUSINESS WIRE) CoreLogic® (NYSE: CLGX), a leading global property information, analytics and data-enabled solutions provider, today released updated data analysis showing 23,044 homes with a total reconstruction cost value (RCV) of approximately $8.6 billion are at high or extreme risk of wildfire damage within the perimeters of the Camp Fire in Northern California and the Woolsey Fire in Southern California.

CoreLogic Logo

Due to the increased containment of these two wildfires, CoreLogic has revised the area of analysis from ZIP code regions to the actual wildfire perimeters. This provides a more precise evaluation of the risk associated with these wildfires. The tables below break down the risk and corresponding RCV for structures affected by each wildfire and its associated perimeter. RCVs represent the cost to completely rebuild a property in the worst-case scenario of total destruction of the structure, including labor and materials by geographic location. While other hazards may cause partial destruction but rarely eliminate an entire property, wildfire events are more likely to cause total loss to structures affected.

Chart

Chart

Understanding the Data:

The tables calculate the number of homes at high or extreme risk from wildfire damage within the perimeter and quantify the risk of homes just outside of the perimeter for both the Camp and Woolsey Fires. However, due to the unpredictable nature of wildfires, it is important to note that even within the perimeter, not all homes will suffer damage; of those that do suffer damage, the damage will not all be equivalent.

Following the containment of the wildfires, CoreLogic will assess the damage and provide a post-catastrophe loss estimate for these areas. For more information visit the CoreLogic natural hazard risk information center, Hazard HQ™, at www.hazardhq.com to get access to the most up-to-date wildfire data and see reports from previous catastrophes.

Methodology

The CoreLogic Wildfire Risk Score is a deterministic wildfire model which is as comprehensive as it is granular. It covers 15 states: Alaska, Arizona, California, Colorado, Florida, Idaho, Montana, Nevada, New Mexico, Oklahoma, Oregon, Texas, Utah, Washington and Wyoming. It evaluates the risk of a property to wildfire by returning an easy-to-understand, normalized 5 to 100 score, giving insight into the potential risk of a wildfire. It considers slope, aspect, vegetation/fuel, and surface composition as well as proximity to higher risk areas that could affect the property via windblown embers. These factors are all weighted differently and combine to form the score.

Source: CoreLogic

The data provided are for use only by the primary recipient or the primary recipient’s publication or broadcast. This data may not be resold, republished or licensed to any other source, including publications and sources owned by the primary recipient’s parent company without prior written permission from CoreLogic. Any CoreLogic data used for publication or broadcast, in whole or in part, must be sourced as coming from CoreLogic, a data and analytics company. For use with broadcast or web content, the citation must directly accompany first reference of the data. If the data is illustrated with maps, charts, graphs or other visual elements, the CoreLogic logo must be included on screen or website. For questions, analysis or interpretation of the data, contact Alyson Austin at newsmedia@corelogic.com or Caitlin New at corelogic@ink-co.com. Data provided may not be modified without the prior written permission of CoreLogic. Do not use the data in any unlawful manner. This data is compiled from public records, contributory databases and proprietary analytics, and its accuracy is dependent upon these sources.

About CoreLogic

CoreLogic (NYSE: CLGX) is a leading global property information, analytics and data-enabled solutions provider. The company’s combined data from public, contributory and proprietary sources includes over 4.5 billion records spanning more than 50 years, providing detailed coverage of property, mortgages and other encumbrances, consumer credit, tenancy, location, hazard risk and related performance information. The markets CoreLogic serves include real estate and mortgage finance, insurance, capital markets, and the public sector. CoreLogic delivers value to clients through unique data, analytics, workflow technology, advisory and managed services. Clients rely on CoreLogic to help identify and manage growth opportunities, improve performance and mitigate risk. Headquartered in Irvine, Calif., CoreLogic operates in North America, Western Europe and Asia Pacific. For more information, please visit www.corelogic.com.

CORELOGIC, the CoreLogic logo and Hazard HQ are trademarks of CoreLogic, Inc. and/or its subsidiaries. All other trademarks are the property of their respective owners.

Contacts

Media Contacts:
Alyson Austin
Corporate Communications
(949) 214-1414
newsmedia@corelogic.com

Caitlin New
INK Communications
(512) 906-9103
corelogic@ink-co.com