New LendingTree study ranks cities by non-owner occupied mortgage originations
Charlotte, NC – June 11, 2018 (PRNewswire) LendingTree®, the nation’s leading online loan marketplace, today released its study on which cities have the highest share of vacation, investment and second homes.

The current housing market is characterized by low inventory for both new and existing homes. With current owners who are willing to sell in short supply, rising interest rates may further exacerbate this issue. Rising rates create a “lock-in” effect where current owners are dissuaded from selling and moving as their new home would come with a higher rate if financed. In the new market, homebuilders are facing rising prices for inputs and labor, which are eroding their profit margins. This is particularly acute for lower-priced homes that are not being build fast enough.
In this environment, every unit of inventory makes a difference for homebuyers. LendingTree’s study looks at the share of mortgages made for non-owner occupied properties to gauge their impact on inventory.
LendingTree analysts ranked the top 50 metros by the share of non-owner occupied loans based on the recently released HMDA data for 2017. Non-owner occupied properties are either vacation homes, investment properties or second homes. The study also looks at the average loan amounts for owners and non-owners.

Key findings from the study include:
- There is a clear regional break. Cities with the most non-owner occupied properties were located in the South or the West, while those with the least are in Northeast and Midwest.
- Southern cities may be attracting investors due to low prices and growing populations. Many residents in Southern cities may not be able to access home ownership due to lower median salaries, creating a ready pool of renters.
- In the West, the opportunity for rapid price appreciation is likely attracting investors. But high prices also suppress homeownership, creating a pool of renters.
- In the Northeast and Midwest, affordable homes mean the opportunity to be a homeowner is high and less appreciation attracts less investors.
- The homeownership rate in the top 10 cities is an average 59 percent compared with just 67 percent in the bottom 10. Even Detroit, a city often cited as having a challenging housing market, has a homeownership rate above all the top 10 cities.
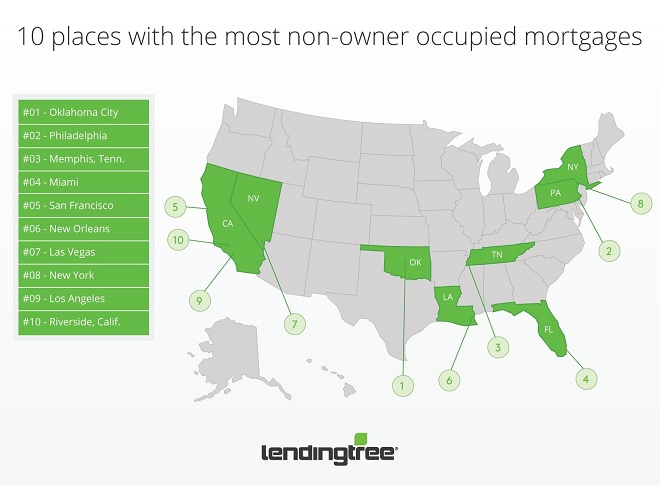
Cities with most non-owner occupied mortgages
#1 Oklahoma City
- Share of Non-Owner Occupied Mortgages: 15.4%
- Non-Owner Occupied Average Loan Size: $193,000
- Owner Occupied Average Loan Size: $182,000
#2 Philadelphia
- Share of Non-Owner Occupied Mortgages: 14.6%
- Non-Owner Occupied Average Loan Size: $245,000
- Owner Occupied Average Loan Size: $225,000
#3 Memphis, Tenn
- Share of Non-Owner Occupied Mortgages: 14.6%
- Non-Owner Occupied Average Loan Size: $126,000
- Owner Occupied Average Loan Size: $192,000
Cities with the least non-owner occupied mortgages
#48 Hartford, Conn.
- Share of Non-Owner Occupied Mortgages: 5.9%
- Non-Owner Occupied Average Loan Size: $237,000
- Owner Occupied Average Loan Size: $215,000
#49 Cleveland
- Share of Non-Owner Occupied Mortgages: 5.7%
- Non-Owner Occupied Average Loan Size: $124,000
- Owner Occupied Average Loan Size: $167,000
#50 Detroit
- Share of Non-Owner Occupied Mortgages: 5.2%
- Non-Owner Occupied Average Loan Size: $115,000
- Owner Occupied Average Loan Size: $163,000
To view the full report, visit: www.lendingtree.com.

About LendingTree
LendingTree (NASDAQ: TREE) is the nation’s leading online loan marketplace, empowering consumers as they comparison-shop across a full suite of loan and credit-based offerings. LendingTree provides an online marketplace which connects consumers with multiple lenders that compete for their business, as well as an array of online tools and information to help consumers find the best loan. Since inception, LendingTree has facilitated more than 65 million loan requests. LendingTree provides free monthly credit scores through My LendingTree and access to its network of over 500 lenders offering home loans, personal loans, credit cards, student loans, business loans, home equity loans/lines of credit, auto loans and more. LendingTree, LLC is a subsidiary of LendingTree, Inc. For more information go to www.lendingtree.com, dial 800-555-TREE, like our Facebook page and/or follow us on Twitter @LendingTree.
MEDIA CONTACT:
Megan Greuling
(704) 943-8208
Megan.greuling@lendingtree.com
Like this:
Like Loading...


