More Than 70 Percent of Homeowners Surveyed Have Delayed a Home Repair or Improvement Due to Their Financial Situation

Nearly Sixty Percent of Homeowners Surveyed only have $5,000 or less to spend on unexpected Home Repair Costs

Riverwoods, IL – June 19, 2018 (BUSINESS WIRE) According to a new study of more than 1,040 American homeowners by Discover Personal Loans, 72 percent have delayed making improvements or repairs to their home due to their financial situation, with 42 percent delaying the project for more than a year. However, when asked whether they were prepared, nearly 54 percent of respondents said they are financially prepared to cover an unexpected home repair.

Discover Logo

When asked how much money they have available to pay for an unexpected repair, nearly three in five (59%) homeowners said they don’t have enough funds to pay for a home repair that costs more than $5,000. That number goes up among millennial homeowners (aged 18-34), with 79 percent not being able to cover the same amount.

According to The True Cost of Home Improvement report by Home Advisor, homeowners who don’t have at least $5,000 may not be able to cover some of the most basic home repairs. Larger repairs such as installing an AC unit or new roof can cost up to $10,000 and over $12,000(1) respectively.

In addition, planning and budgeting for home repairs appears to be a challenge for homeowners surveyed. Nearly one-third (30 percent) of homeowners said that their last unexpected home repair cost more than what they expected.

“The survey indicates that a significant majority delay home repairs and remodels because of limited savings,” said Dan Matysik, vice president of Discover Personal Loans. “Unfortunately, these delays may cost homeowners more in the long-run with additional repairs. If an unexpected home expense arises, homeowners should consider looking into fixed-rate funding options that provide quick access to funds, such as personal loans, to help complete their projects.”

Interestingly, responses to the survey questions were fairly similar across income brackets. For example, 50 percent of homeowners that earned less than $40,000 delayed a home improvement or repair for more than a year as compared to 46 percent among those making $40,000 to $80,000. Additionally, 34 percent of homeowners that earned more than $80,000 delayed a home improvement or repair for more than a year.

About Discover

Discover Financial Services (NYSE: DFS) is a direct banking and payment services company with one of the most recognized brands in U.S. financial services. Since its inception in 1986, the company has become one of the largest card issuers in the United States. The company issues the Discover card, America’s cash rewards pioneer, and offers private student loans, personal loans, home equity loans, checking and savings accounts and certificates of deposit through its direct banking business. It operates the Discover Global Network comprised of Discover Network, with millions of merchant and cash access locations; PULSE, one of the nation’s leading ATM/debit networks; and Diners Club International, a global payments network with acceptance in 190 countries and territories. For more information, visit www.discover.com/company.

ABOUT SURVEY

All figures, unless otherwise stated, are from YouGov Plc. Total sample size was 1045 adults who are homeowners. Fieldwork was undertaken between 22nd – 24th May 2018. The survey was carried out online. The figures have been weighted and are representative of all US adults (aged 18+).

1. https://www.homeadvisor.com/r/true-cost-of-home-improvement/

Media Contact:

Sarah Grage Silberman
Discover
sarahgragesilberman@discover.com
(224) 405-6029

HOME Survey: Housing and Economic Outlook Remains Steady in Second Quarter of 2018

Washington, D.C. – June 21, 2018 (nar.realtor) New findings from the National Association of Realtors® show that a high number of Americans, 75 percent, believe that now is a good time to sell a house, while 68 percent think it is a good time to buy.

NAR Logo

That’s according to NAR’s second quarter Housing Opportunities and Market Experience (HOME) survey(1), which also found that a majority of consumers believe prices have and will continue to increase and that homeownership strengthens our nation’s communities.

Optimism that now is a good time to buy remains stagnant from last quarter; 39 percent strongly agree that now is a good time to buy, while 29 percent moderately agree. Among renters, however, those positive feelings have fallen significantly from 55 percent in the first quarter to 49 percent this quarter. Optimism is highest among older buyers (65 or over) and those living in the South and Midwest regions (73 and 71 percent respectively).

Real Estate Infographic

NAR Chief Economist Lawrence Yun says affordability and low inventory are eroding buyer confidence. “Inventory remains the driving force in real estate, affecting everything for rising prices to household formation. Improving supply conditions is critical to improving buyer optimism and helping to remove some of the barriers holding back potential first-time buyers.”

As home prices continue to climb across the country, the number of respondents who believe now is a good time to sell remains high with 46 percent strongly agreeing (up from 42 percent last quarter) and 29 percent moderately agreeing. Twenty-nine percent believe that now is not a good time to sell a home, and that drops to 19 percent for current homeowners.

“Hopefully this strong seller optimism will lead to an increase in inventory later on in the year,” said Yun.

Respondents were also asked about their perception of home prices in their communities. Sixty-eight percent believe that home prices have gone up in their area in the last 12 months, up from 63 percent last quarter. Fifty-five percent also believe that home prices will continue to increase in their communities in the next six months, also up from the previous quarter (53 percent).

A near high of 58 percent of households believe that the economy is improving – slightly down from 60 percent last quarter but up from 54 percent last year. People in rural areas are more likely to view the economy as improving (63 percent) than in urban areas (51 percent).

The HOME survey’s monthly Personal Financial Outlook Index(2), showing respondents’ confidence that their financial situation will be better in six months, dropped slightly from 63.8 in March to 62.1 in June. A year ago, the index was 57.2.

Forty-six percent of those surveyed say they do not believe it would be difficult to obtain a mortgage, up from 36 percent last quarter. “This is most likely a reflection of the current positive outlook on the direction of the economy,” said Yun. “Healthy job creation and faster wage growth mean that homeownership is viewed as a more attainable goal than it was a year ago.”

Homeownership’s effect on communities, future generations

In this quarter’s survey, homeowners and non-homeowners were asked if a high rate of homeownership strengthens a community. Sixty-seven percent of those surveyed said that homeownership strengthens communities a great deal, and that number jumps to 76 percent for current homeowners and 77 percent for those 65 and older.

“Homeowners are more likely to be involved and engaged in the issues facing their communities, since they tend to be more rooted in the area than renters,” said NAR President Elizabeth Mendenhall, a sixth-generation Realtor® from Columbia, Missouri and CEO of RE/MAX Boone Realty. “This involvement – homeowners are more likely than renters to vote, volunteer their time at local charities and support neighborhood upkeep – helps shape and strengthen our nation’s communities, as well as drive the national economy.”

Respondents were also asked if homeownership will be easier or harder to attain for future generations. Seventy-three percent believe that it will be harder for future generations to purchase a home, compared to only 11 percent who think it will be easier. Seventy-four percent of respondents 34 or under believe it will be more difficult to become homeowners.

About NAR’s HOME survey

In April through June, a sample of U.S. households was surveyed via random-digit dial, including a mix of cell phones and land lines. The survey was conducted by an established survey research firm, TechnoMetrica Market Intelligence. Each month approximately 900 qualified households responded to the survey. The data was compiled for this report and a total of 2,707 household responses are represented.

The National Association of Realtors® is America’s largest trade association, representing 1.3 million members involved in all aspects of the residential and commercial real estate industries.

# # #

1. NAR’s Housing Opportunities and Market Experience (HOME) survey tracks topical real estate trends, including current renters and homeowners’ views and aspirations regarding homeownership, whether or not it’s a good time to buy or sell a home, and expectations and experiences in the mortgage market. New questions are added to the survey each quarter to reflect timely topics impacting real estate. HOME survey data is collected on a monthly basis and will be reported each quarter. New questions will be added to the survey each quarter to reflect timely topics impacting the real estate marketplace.

2. Index ranges between 0 and 100: 0 = all respondents believe their personal financial situation will be worse in 6 months; 50 = all respondents believe their personal financial situation will be about the same in 6 months; 100 = all respondents believe their personal situation will be better in 6 months.

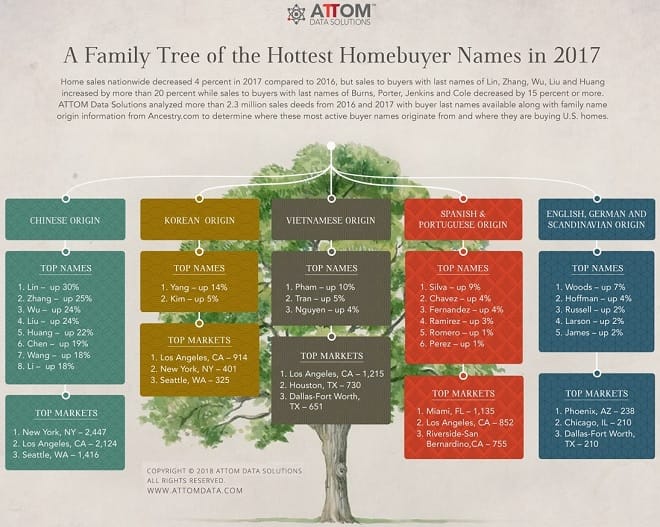
Family Tree of Hottest Homebuyer Last Names in 2017

Eight of Top 10 Hottest Homebuyer Last Names of Chinese Origin; Smith the Hottest Homebuyer Last Name in Eight of 64 Metro Areas Analyzed

Irvine, CA – May 24, 2018 (PRNewswire) ATTOM Data Solutions, curator of the nation’s premier multi-sourced property database, today released its first-ever analysis of homebuyer last names, which shows that while home sales nationwide decreased 4 percent in 2017 compared to 2016, sales to buyers with last names of Lin, Zhang, Wu, Liu and Huang increased by more than 20 percent.

Meanwhile, sales to buyers with last names of Burns, Porter, Jenkins and Cole decreased by 15 percent or more from 2016 to 2017.

ATTOM Logo

For this analysis, ATTOM looked at buyer last names on more than 2.3 million single family home sales deeds nationwide in 2016 and 2017 to determine the hottest names based on year-over-year percentage increase in home purchases. The analysis also looked at family name origin information from Ancestry.com for the hottest homebuyer names, as well as where these buyer names are most active by local market.

Eight of top 10 hottest homebuyer last names of Chinese origin
The top 8 hottest homebuyer last names in 2017 were of Chinese origin, with the ninth and 10th on the list of Korean and Vietnamese origin. The featured infographic maps out family name origin information for all 24 buyer last names with at least 1,000 single family home purchases in 2017 and an increase of at least 1 percent in home purchases compared to 2016.

Click here to view a larger version of the infographic.

Chart

Liu the hottest homebuyer last name in three states
The hottest homebuyer last names in 2017 varied by state, from Liu in Washington to Larson in Florida, and from Mitchell in Nevada to Morales in Colorado. To determine hottest homebuyer last names for each state we looked at names with at least 1,000 home purchases nationwide and at least 50 home purchases statewide in 2017.

One buyer last name registered as hottest in three states — Liu in Maryland (2017 home purchases up 74 percent), Pennsylvania (2017 home purchases up 64 percent), and Washington (2017 home purchases up 68 percent). Eight buyer names came out on top in two states — Anderson in Montana and Oklahoma; Davis in Arkansas and Kentucky; Ellis in Illinois and Virginia; Larson in California and Florida; Miller in Kansas and New Mexico; Nguyen in Louisiana and Oregon; and Walker in Alabama and South Carolina.

This interactive heat map shows the hottest buyer names in each state.

Smith hottest homebuyer last name in eight of 64 metro areas analyzed
Hottest homebuyer last names also varied by metro area — Li in Dallas, Chicago and Houston; Peterson in Los Angeles; Barnes in Atlanta; Castillo in Washington, D.C.; Reyes in Miami; and Yang in New York.

The hottest homebuyer last name was Smith in eight of 64 metropolitan statistical areas analyzed by ATTOM — Dayton, Ohio, Des Moines, Iowa, Fayetteville, Arkansas, Greeley, Colorado, North Port-Sarasota, Florida, Spokane, Washington, Winston-Salem, North Carolina, and Worcester, Massachusetts.

The last name Johnson was the hottest homebuyer last name in five metro areas, with Brown, Williams and Li all registering as hottest in three of the 64 metro areas.

This interactive visual shows the hottest buyer names in select metro areas.

About ATTOM Data Solutions

ATTOM Data Solutions provides premium property data to power products that improve transparency, innovation, efficiency and disruption in a data-driven economy. ATTOM multi-sources property tax, deed, mortgage, foreclosure, environmental risk, natural hazard, and neighborhood data for more than 155 million U.S. residential and commercial properties covering 99 percent of the nation’s population. A rigorous data management process involving more than 20 steps validates, standardizes and enhances the data collected by ATTOM, assigning each property record with a persistent, unique ID — the ATTOM ID. The 9TB ATTOM Data Warehouse fuels innovation in many industries including mortgage, real estate, insurance, marketing, government and more through flexible data delivery solutions that include bulk file licenses, APIs, market trends, marketing lists, match & append and more.

Media Contact:

Christine Stricker
(949) 748.8428
christine.stricker@attomdata.com

Data and Report Licensing:

(949) 502.8313
datareports@attomdata.com