Santa Clara, CA – Jan. 25, 2018 (PRNewswire) Ahead of next week’s State of the Union address, realtor.com® today released its own “State of the Housing Union,” which shows the strong U.S. economy and unprecedented housing shortage pressuring potential home buyers striving to attain the American Dream. According to the analysis, strong buyer demand, constrained inventory, and ready-to-buy first timers are the key underlying dynamics driving today’s housing market.

“The macro-factors that have defined real estate in recent years – strong demand and weak supply – continue to set the tone for the industry,” said Joe Kirchner, senior economist for realtor.com®. “The new tax law that caps the mortgage interest deduction and the deductibility of state and local taxes can be expected to impact the upper-end market in 2018 – precisely how and the extent of which remain to be seen.”
A robust and growing economy
Leading indicators point to a solidly upbeat U.S. economic story. Consumer confidence has spiked, according to the Conference Board’s consumer confidence index, as unemployment fell to its lowest level since 2000 (4.1 percent) and the economy added jobs for a record 86th consecutive month, according to November data from the U.S. Labor Department. At the same time, the U.S. stock markets reached all-time highs over the last few months and retail sales (dollars spent in stores, in restaurants and online) capped a strong year with 2017 holiday sales that increased more than 5.5 percent year over year, according to the National Retail Federation.

Home prices and sales held back by low inventory
Nevertheless, sales growth of existing U.S. homes actually cooled, only increasing 1.1 percent in 2017 as compared to a 3.8 percent gain the previous year. Prices appreciated 5.8 percent on average during 2017, compared to 5.1 percent a year earlier.
Inventory fell 8.8 percent nationally in the 12 months ending Dec. 31, 2017 versus a 10.7 percent dip during the comparable period a year earlier, and tight supply was the single biggest factor affecting the market. Even a sharp increase in new construction – single-family housing starts jumped 8.4 percent and 10.2 percent the previous year – couldn’t offset inventory shortages.
Millennial demand is strong but limited by constrained supply
Realtor.com®data shows millennial aspiring first time home-buyers fell victim to the inventory pinch in the last 12 months. Spurred on by steady employment and life events, such as getting married and starting a family, many of these buyers actively pursued home purchases but hit the wall of tight inventory. With the majority of new construction in mid to upper tier price points, new homes have provided very limited relief to these would-be home owners.
“Builders will need to focus more on homes geared for moderate incomes, partner with the government on initiatives to transform distressed urban neighborhoods and overcome labor shortages through a combination of workforce development training and pressure to ease artificial restrictions on the supply of labor,” added Kirchner.
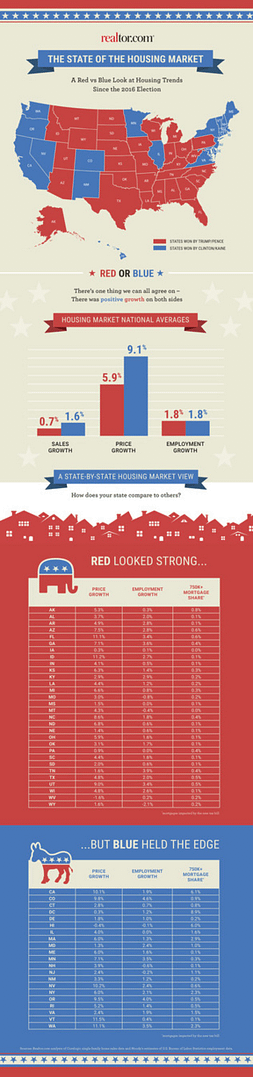
Red vs. blue states in 2017
In a comparison of red and blue states, blue states saw higher home price growth last year, at 9.1 percent, than red states, at 5.9 percent. They also saw stronger sales growth at 1.6 percent versus 0.7 percent in red states.
Blue states – California and Illinois and the tri-state region of New York, New Jersey and Connecticut, for example – skew more urban and suburban than largely rural red states. Highly developed cities, towns and neighborhoods in blue states make finding buildable property extremely challenging, especially with demand at current levels. This supply-and-demand dynamic is the principal reason price appreciation in blue states outstripped price increases in red states in 2017.
Blue states also have some challenges ahead with the tax bill. Last year, 2.5 percent of all mortgages in blue states were more than $750,000 and will be directly impacted by the capping of the mortgage interest deduction in 2018. Conversely, only 0.4 percent of mortgages in red states will be impacted.
Realtor.com® tracks and analyzes market trends and makes timely and insightful information available at realtor.com/research. Data snapshots, affordability distribution and market “hotness” are just some of the resources available at the portal.
About realtor.com®
Realtor.com® is a leading online real estate destination operated by News Corp [NASDAQ: NWS], [NASDAQ: NWSA]; [ASX: NWS]; [ASX: NWSLV] subsidiary Move, Inc. Realtor.com®, a trusted resource for home buyers, sellers and dreamers, offers the most comprehensive source of for-sale properties, among competing national sites, and the information, tools and professional expertise to help people move confidently through every step of their home journey. It pioneered the world of digital real estate 20 years ago, and today helps make all things home simple, efficient and enjoyable. Realtor.com® is operated by Move under a perpetual license from the National Association of REALTORS®. For more information, visit realtor.com®.
Contact:
Lexie Holbert
Lexie.Puckett@move.com
Like this:
Like Loading...