Redfin: Home Prices Post Strongest Gain in Nearly Four Years as a Double-Digit Inventory Decline Constrained Sales

Affordability Pressures Mount as Mortgage Rates Rise

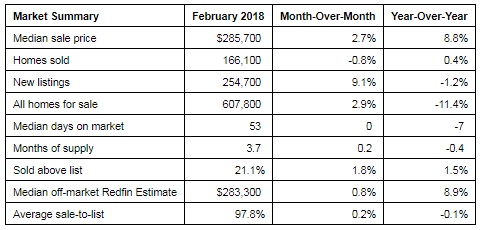
Seattle, WA – March 15, 2018 (PRNewswire) (NASDAQ: RDFN) — Home prices increased 8.8 percent year over year in February, according to Redfin (www.redfin.com), the next-generation real estate brokerage. The median sale price was $285,700 across the markets Redfin serves. This was the strongest February for price appreciation since March 2014. February also marks six years, or 72 consecutive months, of year-over-year price increases since the market bottomed out and began to recover.

Redfin Logo

Constrained by a lack of supply, February home sales were nearly flat, up just 0.4 percent compared to last year. February saw an 11.4 percent decline in the overall number of homes for sale, marking the 29th consecutive month of year-over-year supply declines.

Notwithstanding affordability concerns and low inventory, buyer demand remained strong and market speed continued to increase. The typical home that sold last month went under contract in 53 days, a week faster than one year prior. More than one in five (21.1%) homes that sold last month went for more than their list price, up from 19.6 percent last February. Of the offers Redfin agents wrote for their clients in February, 56 percent encountered competition compared to 58 percent last February.

“Mortgage rates pushed upwards in February to the highest levels in nearly three years as home prices increased by their fastest pace since March 2014,” said Redfin Chief economist Nela Richardson. “A growing economy, healthy buyer demand and low inventory drove the ramp up in prices last month. Combining even slightly higher rates with price growth this strong will make it even more challenging for first-time buyers to find affordable homes to buy this year. The good news for sellers is modest rate increases are unlikely to curtail buyer demand. Just 6 percent of respondents to a survey commissioned by Redfin said they would cancel their home buying plans if rates rose above 5 percent.”

The median value of off-market homes was $283,300, as measured by the Redfin Estimate, up 8.9 percent from last year. 58.1 percent of homes on the market in February were priced above their Redfin Estimate value, with a Redfin-List-to-Estimate Ratio of 100.3 percent, indicating that sellers are slightly overpricing their homes.
Chart

Other February Highlights

Competition

  • Seattle, WA was the fastest market, with half of all homes pending sale in just 8 days, down from 12 days from a year earlier. Denver, CO and San Jose, CA were the next fastest markets with 9 and 10 median days on market, followed by Oakland, CA (13) and San Francisco, CA (14).
  • The most competitive market in February was San Jose, CA where 83.1% of homes sold above list price, followed by 74.4% in San Francisco, CA, 67.5% in Oakland, CA, 54.8% in Seattle, WA, and 44.4% in Tacoma, WA.

Prices

  • San Jose, CA had the nation’s highest price growth, rising 34.1% since last year to $1,180,000. Detroit, MI had the second highest growth at 19.8% year-over-year price growth, followed by Fresno, CA (19.5%), Tacoma, WA (17.9%), and New Orleans, LA (17.7%).
  • No metros saw price declines in February.

Sales

  • Long Island, NY saw the largest decline in sales since last year, falling 32.6%. Home sales in Minneapolis, MN and Miami, FL declined by 13.0% and 12.9%, respectively.
  • 6 out of 73 metros saw sales surge by double digits from last year. Louisville, KY led the nation in year-over-year sales growth, up 24.7%, followed by Greenville, SC, up 18.4%. Oklahoma City, OK rounded out the top three with sales up 15.8% from a year ago.

Inventory

  • Rochester, NY had the largest decrease in overall inventory, falling 40% since last February. Buffalo, NY (-39.6%), Atlanta, GA (-33.1%), and Albany, NY (-30.7%) also saw far fewer homes available on the market than a year ago.
  • Salt Lake City, UT had the highest increase in the number of homes for sale, up 49.9% year over year, followed by Baton Rouge, LA (31.8%) and Washington, DC (13.9%).

Redfin Estimate

  • The median list price-to-Redfin Estimate ratio was 93.3% in San Francisco, CA, the lowest of any market. This indicates the typical home for sale in February was listed at a price 6.7% below its estimated value. Only 8.1% of homes in San Francisco, CA were listed for more than their Redfin Estimate.
  • Conversely, the median list price-to-Redfin Estimate ratio was 102.6% in Miami, FL and 102.3% in West Palm Beach, FL, which means sellers are listing their homes for more than the estimated value in those metro areas. In Miami, FL, 86.4% of homes were listed above their Redfin Estimate, the highest percentage of any metro.

To read the full report, complete with data and charts, please visit the following link:
https://www.redfin.com/blog/2018/03/market-tracker-february-2018.html

About Redfin

Redfin (www.redfin.com) is the next-generation real estate brokerage, combining its own full-service agents with modern technology to redefine real estate in the consumer’s favor. Founded by software engineers, Redfin has the country’s #1 brokerage website and offers a host of online tools to consumers, including the Redfin Estimate, the automated home-value estimate with the industry’s lowest published error rate for listed homes. Homebuyers and sellers enjoy a full-service, technology-powered experience from Redfin real estate agents, while saving thousands in commissions. Redfin serves more than 80 major metro areas across the U.S. The company has closed more than $60 billion in home sales.

Trulia Unveils New Mission To Help Buyers And Renters Discover Homes And Neighborhoods They’ll Love

Bringing its mission to life, Trulia launches new product feature, What Locals Say, and national advertising campaign

San Francisco, CA – March 19, 2018 (PRNewswire) Trulia®, a home and neighborhood site for homebuyers and renters, today launched a new product feature, What Locals Say, and a national advertising campaign inspired by Trulia’s new mission: “Build a more neighborly world by helping you discover a place you’ll love to live.”

trulia-logo

Trulia’s mission aims to solve an unmet need for rich neighborhood insights — everything from a home’s proximity to nearby parks and restaurants to getting a feel for the surrounding community. Through extensive consumer research conducted in 2017, Trulia found that 85% of homebuyers who plan to buy within 18 months say that the neighborhood is equally or more important than the house. In fact, 76% of those same buyers said one of their drivers for moving was a neighborhood- or life stage-related reason, such as wanting a different lifestyle because of a baby or marriage, a shorter commute, or finding the right school for their children.

“More than 10 years ago, Trulia revolutionized the way people found homes by making real estate listings searchable online. Fast forward to 2018, house hunters now expect to see listings on the Internet,” said Tim Correia, senior vice president and general manager of Trulia. “We understand that neighborhoods matter. Our new mission will guide Trulia to deliver even more innovative products to help buyers and renters discover and understand what it’s really like to live in a home and neighborhood before they move in, much like a trusted friend or neighbor.”

Trulia 1

Trulia 2

Delivering Neighborhood Insights Straight From Locals
What Locals Say provides house hunters with neighborhood insights straight from locals. This new feature is now available on Trulia’s for-sale and rental listings to help shed light on information that is not easily found elsewhere.

At launch, What Locals Say already features more than seven million answered polls and written reviews by locals to give an authentic picture of what it’s like to live in a neighborhood. While reviews highlight what locals love about their neighborhood, the polls reveal whether most locals talk to their neighbors, see people walking their dogs around the block, decorate their homes for the holidays, can find easy parking, take care of their yards, and more. On average, locals are submitting about 100,000 poll responses and reviews a day, which will only continue to expand the feature’s reach to more neighborhoods across the country.

New Ads Show How Trulia Brings A Neighborhood To Life
Trulia’s national ad campaign, “Insiders,” illustrates how the brand delivers on its new mission. The campaign personifies Trulia through colorful, authentic, and entertaining neighborhood insiders — Paperboy Pete and Dog Walker Dana — who take viewers on a neighborhood tour of the world beyond driveways and mailboxes. The ads showcase Trulia’s 34 different map overlays that offer details on commute, reported crime, schools, and nearby businesses, and the new What Locals Say feature. In addition to the two ads (0:15 and 0:30 second formats) running across cable networks, the campaign also includes an additional spot built for digital video, as well as 0:06 second pre-roll videos.

“We met with people across the country as part of our research, and one truth rang clear: when people search for a home, they are also searching for a neighborhood that suits their lifestyle,” said Alissa Reiter, vice president of marketing at Trulia. “We want people to know Trulia as the trusted partner that will help them really understand a neighborhood’s community and culture.”

Trulia’s brand strategy and creative were developed in partnership with its agency of record, Venables Bell & Partners, a relationship that began last year. The ads were directed by Speck and Gordon with production company, Furlined. Trulia’s new TV ads can be found on its YouTube Channel: https://www.youtube.com/trulia.

For more information, visit www.trulia.com/blog/tech/what-locals-say.

About Trulia
Trulia’s mission is to build a more neighborly world by helping you discover a place you’ll love to live. Homebuyers and renters use Trulia’s website and suite of mobile apps to get a deeper understanding of homes and neighborhoods across the U.S. through personalized recommendations, insights sourced straight from locals, and 34 different map overlays that offer details on commute, reported crime, schools, nearby businesses, and more. Founded in 2005, Trulia is based in San Francisco, and owned and operated by Zillow Group, Inc. (NASDAQ: Z and ZG). Trulia is a registered trademark of Trulia, LLC.

For further information:
Daisy Kong
pr@trulia.com
(415) 400-7391

Millennials Lead All Homebuyers, Even as Some Can’t Escape Their Parents

Washington, D.C. – March 14, 2018 (nar.realtor) Home purchases by millennials ticked up over the past year, but inventory constraints and higher housing costs kept their overall activity subdued and prevented some from leaving the more affordable confines of their Gen X and baby boomer parents’ homes.

NAR Logo

This is according to the National Association of Realtors® 2018 Home Buyer and Seller Generational Trends study, which evaluates the generational differences(1) of recent home buyers and sellers. The survey additionally found that millennial buyers prioritize living close to friends and family over a home’s location and proximity to schools, and an overwhelming majority used a real estate agent to buy or sell a home.

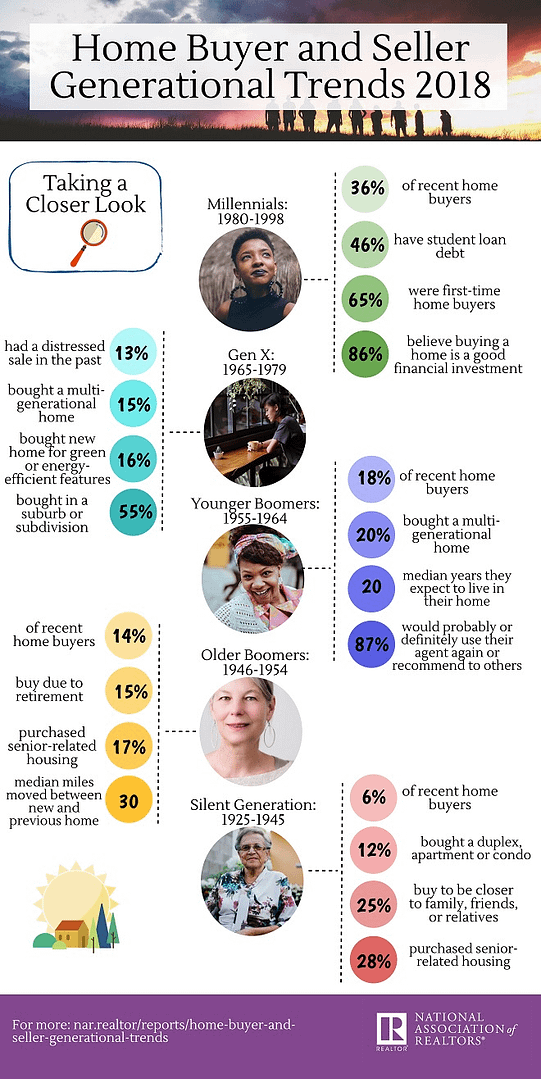
Slightly more than a third of all home purchases were made by millennials over the past year (36 percent; 34 percent in 2017), which kept them as the most active generation of buyers for the fifth consecutive year. Gen X buyers ranked second (26 percent; 28 percent in 2017), followed by younger (18 percent) and older baby boomers (14 percent) and the Silent Generation, those born between 1925 and 1945 (6 percent; 8 percent in 2017).

According to Lawrence Yun, NAR chief economist, this year’s survey findings reveal both what it takes to be a successful millennial buyer in today’s housing market, as well as why, even though sales to millennials reached an all-time survey high, stubbornly low inventory conditions pushed home prices out of reach for many. As a result, the overall share of millennial buyers remains at an underperforming level.

Real Estate Infographic

Revealing the greater purchasing power needed over the past year, the typical millennial buyer in the survey had a higher household income ($88,200) than a year ago ($82,000) and purchased the same-sized home (1,800-square-feet) at a more expensive price ($220,000; $205,000 in 2017). Millennials also had higher student debt balances than in last year’s survey, and slightly more of them said saving for a down payment was the most difficult task in buying a home.

“Realtors® throughout the country have noticed both the notable upturn in buyer interest from young adults over the past year, as well as mounting frustration once they begin actively searching for a home to buy,” said Yun. “Prices keep rising for the limited number of listings on the market they can afford, which is creating stark competition, speedy price growth and the need to save more in order to buy.”

Added Yun, “These challenging market conditions have caused – and will continue to cause – many aspiring millennial buyers to continue renting unless more Gen Xers decide to sell, and entry-level home construction picks up significantly.”

Other key findings and notable generational trends of buyers and sellers in this year’s 144-page survey include:

Younger boomers and Gen X buyers increasingly have children and parents living at home
Similar to previous years, younger boomers were the most likely to purchase a multi-generational home (20 percent), with a noteworthy rise in those indicating the top reason they did was for their adult children (above 18 years old) to live at home (39 percent; 30 percent in 2017), as well as their parents (22 percent; 18 percent in 2017).

The survey also found a growing a share of Gen X buyers buying for multi-generational purposes (15 percent; 12 percent in 2017), with a big jump in the top reason being for their adult children (35 percent; 26 percent in 2017) and parents living with them (30 percent; 19 percent in 2017).

“Costly rents and growing student debt balances appear to make living at home more appealing, affordable and increasingly more common among young adults just entering the workforce,” said Yun. “Even in situations where three generations are all cramped under the same roof, it can significantly help some millennials eventually transition straight to homeownership. Eighteen percent of millennial buyers in the survey said their family home was their previous living arrangement.”

Friends and family matter for buyers both young and old
When deciding where to buy a home, quality of the neighborhood is the factor most influencing buyers of all ages, followed closely by convenience to a job for those up to working age (millennials to younger boomers). Interestingly, even more than the location and quality of a school, recent millennial buyers were just as likely as older boomers and the Silent Generation (at 43 percent) to consider proximity to friends and family.

“The sense of community and wanting friends and family nearby is a major factor for many homebuyers of all ages,” said Yun. “Similar to Gen X buyers who have their parents living at home, millennial buyers with kids may seek the convenience of having family nearby to help raise their family.”

Millennials buying condos in the city at a very low rate
The share of millennial buyers with at least one child continues to grow, at 52 percent in this year’s survey and up from 49 percent a year ago and 43 percent in 2015. With the need for a larger house at an affordable price, over half of millennials bought in a suburban location (52 percent), while also being more likely than Gen Xers and younger boomers to choose a home in a small town. After climbing as high as 21 percent in 2015, only 15 percent of recent millennial buyers purchased a home in an urban area.

Led by Gen X (86 percent) and millennial buyers (85 percent), a detached single-family home continues to be the primary type of property purchased, and older and younger boomers were the most likely to buy a multi-family home. Only 2 percent of millennial buyers over the past year bought a condo.

“While there is an overall trend among households young and old to migrate towards urban areas, the very low production of new condos means there are few affordable options for buyers – especially millennials,” said Yun.

Regardless of age, most buyers and sellers work with a real estate agent
Buyers and sellers across all age groups continue to seek the assistance of a real estate agent when buying and selling a home. At 90 percent, millennials were the most likely to purchase a home through a real estate agent, and help understanding the buying process was cited as the top benefit millennials said their agent provided (75 percent). Overall, at least 84 percent in every other generation worked with an agent to close the deal.

On the seller side, Gen X and older boomers were the most likely to use an agent (91 percent), followed closely by millennials (90 percent) and younger boomers (88 percent). The near universal use of an agent to sell a home helped keep for-sale-by-owner transactions at their lowest share ever for the third straight year (8 percent).

“Especially in today’s fast-moving housing market, consumers of all ages want a Realtor® to guide them through the exhilarating, yet nerve-wracking experience of buying or selling a home,” said NAR President Elizabeth Mendenhall, a sixth-generation Realtor® from Columbia, Missouri and CEO of RE/MAX Boone Realty.

NAR mailed a 131-question survey in July 2017 using a random sample weighted to be representative of sales on a geographic basis to 145,800 recent home buyers. Respondents had the option to fill out the survey via hard copy or online; the online survey was available in English and Spanish. A total of 7,866 responses were received from primary residence buyers. After accounting for undeliverable questionnaires, the survey had an adjusted response rate of 5.6 percent. The sample at the 95 percent confidence level has a confidence interval of plus-or-minus 1.10 percent.

The recent home buyers had to have purchased a home between July 2016 and June 2017. All information is characteristic of the 12-month period ending in June 2017 with the exception of income data, which are for 2016.

The National Association of Realtors® is America’s largest trade association, representing 1.3 million members involved in all aspects of the residential and commercial real estate industries.

###

1. Survey generational breakdowns: millennials (ages 37 and under); Generation X (ages 38-52); younger boomers (ages 52-61); older boomers (ages 62-70); and the Silent Generation (ages 71-91).