New Homeowners Face Tax Disadvantage in Many U.S. States

Tax breaks for longtime homeowners are one of many issues analyzed in the annual 50-State Property Tax Comparison Study by the Lincoln Institute of Land Policy and Minnesota Center for Fiscal Excellence

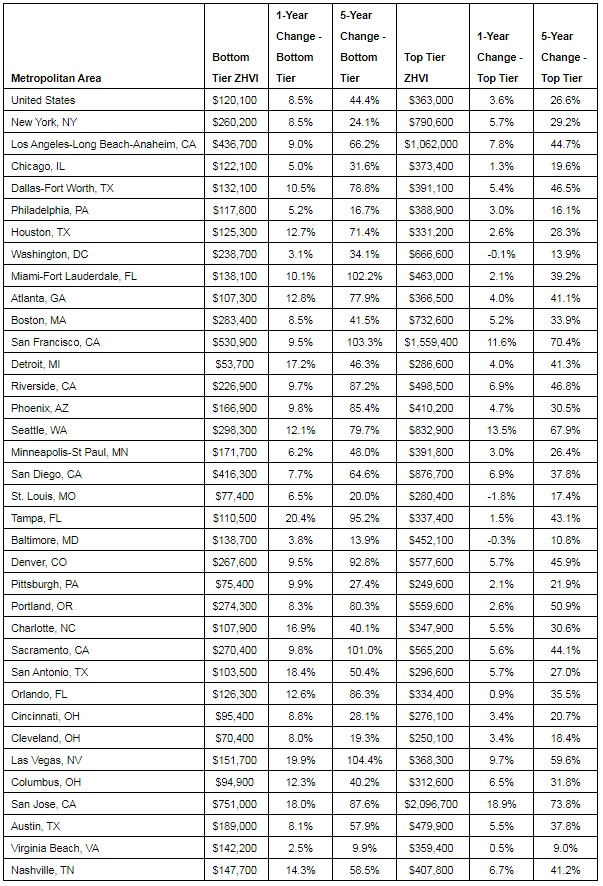
Cambridge, MA – April 17, 2018 (PRNewswire-USNewswire) In Los Angeles, a new owner of a median-valued home pays about $7,000 per year in property taxes – nearly double the $4,000 paid by someone who has owned an identical home for 14 years, the average length of homeownership in the city, according to the annual 50-State Property Tax Comparison Study by the Lincoln Institute of Land Policy and the Minnesota Center for Fiscal Excellence.

Lincoln Institute of Land Policy Logo

Such preferential treatment of longtime homeowners is a function of California’s Proposition 13, the 1978 ballot initiative that greatly restricts reassessment of property, among its many tax-limiting provisions. Of the ten American cities with the greatest discrepancy in taxes paid by new homeowners and longtime homeowners, six are in California and two are in Florida, where the 1992 Save Our Homes constitutional amendment similarly restricts reassessment.

These discrepancies are just one phenomenon explored through the study’s comprehensive analysis of effective property tax rates – the tax paid as a percentage of market value – in more than 100 cities in every U.S. state and Washington, DC.

State Property Tax ComparisonAs the study makes clear, the property tax is the most stable source of revenue for schools, public safety, and other public services and infrastructure provided by local governments. Effective tax rates vary widely, and, drawing on data for 73 large U.S. cities and a rural municipality in each state, the study explains the reasons why.

Reliance on the property tax is chief among the reasons. Cities with high local sales or income taxes do not need to raise as much revenue from the property tax and thus have lower property tax rates on average. For example, Bridgeport (CT) has one of the highest effective tax rates on the median-valued home, while Birmingham (AL) has one of the lowest. But the average Birmingham resident pays 30 percent more in total local taxes when accounting for sales, income, and other local taxes.

Highest and Lowest Effective Property Tax Rates on a Median-Valued Home (2017)

Chart

Property values are the other crucial factor explaining differences in tax rates. Cities with low property values need to impose a much higher tax rate to raise the same revenue as cities with high property values. For example, the effective tax rate on the typical home in Detroit, which has the lowest median home values in the study, is four times higher than in San Francisco, which has the highest. In Detroit, to raise $3,000 per home – the national average tax bill on a median-valued home – would require an effective tax rate 24 times higher than in San Francisco.

The other drivers of variation in property tax rates include the treatment of different classes of property, such as residential and commercial, and the level of local government spending.

The average effective tax rate on a median-valued home was 1.49 percent in 2017, with wide variation across cities. Three cities have effective tax rates that are roughly 2.5 times higher than the average – Bridgeport (CT), Aurora (IL), and Detroit. Conversely, seven cities have tax rates less than half of the study average – Honolulu, Charleston (SC), Boston, Cheyenne (WY), Denver, Birmingham, and Washington, DC.

Commercial property tax rates on office buildings and similar properties also vary significantly across cities. The effective tax rate on a $1 million commercial property is about 2 percent, on average, across the largest cities in each state. The highest rates are in Detroit, New York City, Bridgeport, Chicago, and Providence, where rates are at least 75 percent higher than average. Rates are less than half of the average in Fargo (ND), Virginia Beach, Honolulu, Seattle, and Cheyenne (WY).

Highest and Lowest Effective Property Tax Rates on $1-Million Commercial Property

Chart

The study includes a detailed analysis of classification, the practice of taxing specific types of property differently. New York City has the nation’s largest discrepancy between rental apartments and owner-occupied homes, with an effective property tax rate for apartment buildings that is nearly five times higher than the rate for owner-occupied homes, or “homesteads.” Boston has the largest discrepancy between commercial properties and owner-occupied homes, with an effective tax rate on commercial properties that is 4.3 times the rate for homesteads. On average, effective property tax rates for commercial properties are 64 percent higher than for owner-occupied homes, and effective rates for apartments are 33 percent higher.

The report is available for download on the Lincoln Institute website.

The Lincoln Institute of Land Policy seeks to improve quality of life through the effective use, taxation, and stewardship of land. A nonprofit private operating foundation whose origins date to 1946, the Lincoln Institute researches and recommends creative approaches to land as a solution to economic, social, and environmental challenges. Through education, training, publications, and events, we integrate theory and practice to inform public policy decisions worldwide.

The Minnesota Center for Fiscal Excellence was founded in 1926 to promote sound tax policy, efficient spending, and accountable government. As a non-profit, non-partisan group supported by membership dues, the center pursues its mission by educating and informing Minnesotans about sound fiscal policy; providing state and local policy makers with objective, non-partisan research about the impacts of tax and spending policies; and advocating for the adoption of policies reflecting principles of fiscal excellence.

Owners of the Least Expensive Homes Gaining Wealth Faster Than Any Other Homeowner

But tight inventory and strong demand for these homes make it difficult for buyers to enter the market

– Owners of starter homes have gained 44 percent in equity over the past five years, while owners of the most valuable homes have gained 27 percent over the same time period.

– Affordable homes in Tampa, Florida saw the greatest appreciation over the past year among the largest U.S. metros, gaining 20 percent in value.

– Seattle and the Bay Area are the only large markets where the most valuable homes are gaining value faster than affordable homes.

Seattle , WA – Feb. 16, 2018 (PRNewswire) Owners of starter homes across the country are gaining equity faster than other homeowners because demand for entry-level homes continues to grow faster than supply.

The phenomenon – which has become more pronounced over the past few years — underscores the power of homeownership to build wealth, particularly among the middle class.

Zillow Logo

For this analysis, Zillow® divided the U.S. housing stock into equal thirds based on value and determined the median value of the most and least valuable homes. Over the past year, homes in the most affordable segment of the market, which are often sought after by first-time buyers, gained 8.5 percent in value, compared to a 3.6 percent gain for the most expensive homes. Over the past five years, the difference is even more noticeable — people who own starter homes have seen their equity grow by 44.4 percent, while owners of top-tier homes have gained 26.6 percent.

A home is the biggest financial asset and a significant share of net worth for many homeowners. Less affluent homeowners typically have more of their wealth in their homes than homeowners with a higher net worthi. Owners of more affordable homes are seeing their homes’ value, and therefore their overall wealth, grow rapidly.

“When the housing market crashed, owners of the least valuable homes were especially hard hit, and lost more home value than homeowners at the upper end of the market,” said Zillow senior economist Aaron Terrazas. “Since then, though, demand for less expensive, entry-level homes has built steadily, causing prices to grow rapidly. As a result, these homeowners have been able to build wealth at a faster pace than owners of more expensive homes.”

Strong home value appreciation among more affordable homes is beneficial for people who own those homes, but also makes it difficult for buyers trying to enter the market. Inventory among the most affordable homes is extremely limited, making for a highly competitive market going into home shopping season — there are nearly 18 percent fewer entry-level homes available now than a year ago.

Among the largest U.S. housing markets, owners of the cheapest homes in Tampa, Florida are seeing the greatest gains in home equity. Over the past year, these homes have gained 20.4 percent in value. Las Vegas homeowners are close behind. The most affordable homes there have appreciated 19.9 percent from last year.

San Francisco, Seattle and San Jose, California are the only large markets where the most expensive homes are gaining value faster than starter homes.

Chart

Zillow

Zillow is the leading real estate and rental marketplace dedicated to empowering consumers with data, inspiration and knowledge around the place they call home, and connecting them with the best local professionals who can help. In addition, Zillow operates an industry-leading economics and analytics bureau led by Zillow’s Chief Economist Dr. Svenja Gudell. Dr. Gudell and her team of economists and data analysts produce extensive housing data and research covering more than 450 markets at Zillow Real Estate Research. Zillow also sponsors the quarterly Zillow Home Price Expectations Survey, which asks more than 100 leading economists, real estate experts and investment and market strategists to predict the path of the Zillow Home Value Index over the next five years. Launched in 2006, Zillow is owned and operated by Zillow Group, Inc. (NASDAQ: Z and ZG), and headquartered in Seattle.

Zillow is a registered trademark of Zillow, Inc.

(i) https://www.zillow.com/research/black-hispanic-home-wealth-16753/

End of 2017 Sees Homeowners and Appraisers More In Agreeance than in the Past Two Years

– Quicken Loans’ National HPPI shows appraised values 0.50% lower than homeowners estimated in December

– Home values rose 0.65% nationally in December, with a 6.17% year-over-year increase, according to the Quicken Loans HVI

Detroit, MI – Jan. 9, 2018 (PRNewswire) The views of homeowners, and those who appraise their properties, are continuing to move closer together. Home appraisals were an average of 0.5 percent lower than what owners expected in December, according to the National Quicken Loans Home Price Perception Index (HPPI). These two data points have moved closer together since November, when appraised values were 0.67 percent lower than homeowners’ estimates, and far improved from one year ago when there was a full 1 percent difference in valuation.

Quicken Loans Logo

Increasing equity continues to be another source of good news for homeowners. The National Quicken Loans Home Value Index (HVI) reported the average appraisal value climbed 0.65 percent higher from November to December, and jolted ahead 6.17 percent compared to the previous December.

Home Price Perception Index (HPPI)

Appraisals in December were an average of 0.5 percent lower than what homeowners estimated at the beginning of the mortgage process. Although the average appraisal continues to lag homeowner estimates, the gap between the two numbers was narrower in December than it has been since March 2015. The current narrowing trend is in its seventh-straight month. While perceptions vary between metro areas, they are improving at the metro level. A negative value, which indicates that appraiser opinions are lower than homeowner perceptions, was only indicated in a quarter of metro areas measured by the HPPI.

“Appraisers and real estate professionals evaluate their local housing markets daily. Homeowners, on the other hand, may only think about their housing market when they see ‘for sale’ signs hit front yards in the spring or when they think about accessing their equity,” said Bill Banfield, Quicken Loans Executive Vice President of Capital Markets. “This is reflected in the HPPI. The housing markets that are rising quickly, like those in the West, are having appraisal values increasing above owner estimates because owners don’t realize just how quickly those markets are advancing.”

Chart

Home Value Index (HVI)

The HVI, the only measure of home value change based solely on appraisal data, showed promising growth. Values rose 0.5 percent from November to December, and 2017 ended on a strong note with the HVI rising 6.54 percent from January to December. The Northeast is the only region to show a monthly dip in value, but all regions reported annual growth – topping out with a 7.42 percent jump in the West.

“Homeowners received the gift of added equity this holiday season,” said Banfield. “With several years of growth, owners may have more equity than they realize. Many consumers use the tax season at the beginning of the year to reevaluate their entire financial life. It also provides a good opportunity for them to consider how best to take advantage of their equity while mortgage interest rates and borrowing costs are still near record lows.”

Chart 1

*A positive value represents appraiser opinions that are higher than homeowner perceptions. A negative value represents appraiser opinions that are lower than homeowner perceptions.

Chart 2

*A positive value represents appraiser opinions that are higher than homeowner perceptions. A negative value represents appraiser opinions that are lower than homeowner perceptions.

Chart 3

*A positive value represents appraiser opinions that are higher than homeowner perceptions. A negative value represents appraiser opinions that are lower than homeowner perceptions.

About the HPPI & HVI

The Quicken Loans HPPI represents the difference between appraisers’ and homeowners’ opinions of home values. The index compares the estimate that the homeowner supplies on a refinance mortgage application to the appraisal that is performed later in the mortgage process. This is an unprecedented report that gives a never-before-seen analysis of how homeowners are viewing the housing market. The HPPI national composite is determined by analyzing appraisal and homeowner estimates throughout the entire country, including data points from both inside and outside the metro areas specifically called out in the above report.

The Quicken Loans HVI is the only view of home value trends based solely on appraisal data from home purchases and mortgage refinances. This produces a wide data set and is focused on appraisals, one of the most important pieces of information to the mortgage process.

The HPPI and HVI are released on the second Tuesday of every month. Both of the reports are created with Quicken Loans’ propriety mortgage data from the 50-state lenders’ mortgage activity across all 3,000+ counties. The indexes are examined nationally, in four geographic regions and the HPPI is reported for 27 major metropolitan areas. All indexes, along with downloadable tables and graphs can be found at QuickenLoans.com/Indexes.

About Quicken Loans

Detroit-based Quicken Loans Inc. is the nation’s second largest retail home mortgage lender. The company closed more than $400 billion of mortgage volume across all 50 states from 2013 through 2017. Quicken Loans moved its headquarters to downtown Detroit in 2010, and now more than 17,000 team members from Quicken Loans and its Family of Companies work in the city’s urban core. The company generates loan production from web centers located in Detroit, Cleveland and Scottsdale, Arizona. The company also operates a centralized loan processing facility in Detroit, as well as its San Diego-based One Reverse Mortgage unit.

Quicken Loans ranked “Highest in Customer Satisfaction for Primary Mortgage Origination” in the United States by J.D. Power for the past eight consecutive years, 2010 – 2017, and highest in customer satisfaction among all mortgage servicers the past four years, 2014 – 2017.

Quicken Loans was ranked No. 10 on FORTUNE magazine’s annual “100 Best Companies to Work For” list in 2017, and has been among the top 30 companies for the past 14 consecutive years. The company has been recognized as one of Computerworld magazine’s “100 Best Places to Work in IT” the past 13 years, ranking No. 1 for eight of the past 12 years, including 2017. The company is a wholly-owned subsidiary of Rock Holdings, Inc., the parent company of several FinTech and related businesses. Quicken Loans is also the flagship business of Dan Gilbert’s Family of Companies comprising nearly 100 affiliated businesses spanning multiple industries. For more information and company news visit QuickenLoans.com/press-room.