Redfin Report: Shrinking Supply Sends Prices for Luxury Homes Up Nearly 8 Percent in First Quarter

Number of Luxury Homes for Sale Fell 20 Percent, Marking Four Consecutive Quarters of Inventory Declines

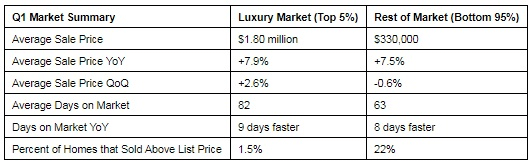
Seattle, WA – May 14, 2018 (PRNewswire) (NASDAQ: RDFN) Luxury home prices in the first quarter of 2018 rose 7.9 percent compared to last year, to an average of $1.8 million, according to the latest report from Redfin (www.redfin.com), the next-generation real estate brokerage. The analysis tracks home sales in more than 1,000 cities across the country and defines a home as luxury if it is among the top 5 percent most expensive homes sold in the city in each quarter. The average price for the bottom 95 percent of homes was $330,000, up 7.5 percent compared to a year earlier.

Redfin Logo

The strong price growth for luxury homes is due to decline in supply that has persisted since the second quarter of 2017. The number of homes for sale priced at or above $1 million fell 20.4 percent in the first quarter compared to a year earlier, while the number of homes priced at or above $5 million dropped 19.2 percent.

The inventory shortage in the luxury market is newer and somewhat less severe than the inventory shortage for more affordable homes. The number of homes for sale priced below $1 million has been in decline since the third quarter of 2015 and fell 22.8 percent in the first quarter compared to last year.

Competition for luxury homes is also escalating. The average luxury home that sold last quarter went under contract after 82 days on the market, nine days faster than the same period last year. While only 1.5 percent of luxury homes were bid up over the asking price, that’s up from 1.3 percent in the first quarter of 2017.

“For the first time since changes to the tax code went into effect, luxury buyers could no longer deduct more than $10,000 in state and local property taxes or interest for mortgages over $750,000. In a world of balanced supply and demand these changes would have dampened price growth. Instead, this quarter saw the strongest luxury price appreciation in four years, demonstrating that the current inventory crunch is extremely broad-based and affects buyers at every price range,” said Redfin chief economist Nela Richardson.

Chart

Several cities in Florida and Nevada saw strong luxury price growth in the first quarter. In Vero Beach, Florida, the average sale price for a luxury home soared 68 percent over last year to $2.65 million. The early January sale of a $17.5 million property likely played a role in driving up the average sale price in Vero Beach.

Luxury home prices were up 51.3 percent in Reno, 26 percent in Las Vegas and 22.4 percent in Henderson, a Las Vegas suburb.

Jaime Moore, a Redfin agent in Reno, said, “We’re seeing an influx of buyers from high-cost areas such as Seattle, San Francisco and Southern California. Some come for retirement and the low taxes, others for tech jobs at companies like Tesla, Amazon and Switch. More companies are relocating here as the cost of living for the average employee has gotten too high in other cities. This is all leading many buyers to our area with larger pocketbooks than we have seen in the past and bidding wars and prices are reflecting that demand.”

Some cities saw luxury home prices decline in the first quarter. The average price for a luxury home fell furthest in Long Beach, California, down 26.1 percent year over year last quarter. Prices for high-end properties also fell in Washington, D.C. (-9.6%), Fort Lauderdale (-7.3%) and Clearwater (-4.5%).

To read the full report, complete with city-specific data and charts, as well as a list of the 10 highest-priced home sales in Redfin markets in the first quarter, visit: www.redfin.com.

About Redfin

Redfin (www.redfin.com) is the next-generation real estate brokerage, combining its own full-service agents with modern technology to redefine real estate in the consumer’s favor. Founded by software engineers, Redfin has the country’s #1 brokerage website and offers a host of online tools to consumers, including the Redfin Estimate, the automated home-value estimate with the industry’s lowest published error rate for listed homes. Homebuyers and sellers enjoy a full-service, technology-powered experience from Redfin real estate agents, while saving thousands in commissions. Redfin serves more than 80 major metro areas across the U.S. The company has closed more than $60 billion in home sales.

Inventory at Historic Lows, Majority of Homes for Sale are at the High End

– There are almost 9 percent fewer homes on the market than a year ago, and the majority of them are ones first-time buyers can’t afford

– Home shoppers have almost 9 percent fewer homes to choose from than a year ago, and more than half of them are high-end homes.

– Inventory is down the most in San Jose, Calif., Las Vegas and Indianapolis.

– Home values across the U.S. rose 8 percent since last March, to a median of $213,146. San Jose, Calif. and Las Vegas reported the greatest home value growth over the past year.

– U.S. median rent rose 2.7 percent over the past year, to $1,447.

– Rent is rising fastest in West Coast markets Sacramento, Calif., Riverside, Calif., and Seattle.

Seattle, WA – April 26, 2018 (PRNewswire) There are almost 9 percent fewer homes on the market than a year ago, and the majority of those are unaffordable for most first-time homebuyers. More than half of all homes for sale across the U.S. are at the high end of the market, according to the March Zillow® Real Estate Market Report(i).

Zillow Logo

More millennials are aging into their prime home buying years and looking to buy their first home, but there are very few homes on the market that are affordable for them. Among all homes on the market right now, just 22 percent are entry-level, among the least expensive on the market.

This year’s home-shopping season will be one of the most competitive ever recorded. Inventory has been falling since the beginning of 2015, and with so few homes for sale, many are going for over asking price.

“This year’s home-shopping season is shaping up to be even crazier than last, and sadly, the group that will have the hardest time is first-time and lower-income homebuyers,” said Zillow Chief Economist Svenja Gudell. “These buyers will be competing for the few entry-level homes on the market, which are also the ones appreciating the fastest because of extremely high demand. One way to take the edge off would be an increase in inventory, but that is easier said than done. There are some signals a shift may be coming – construction activity is at its highest point in a decade – but buyers shouldn’t hold their breath. Getting pre-approved for a mortgage and finding an agent you trust can go a long way in helping buyers act quickly once the right home does become available in this otherwise tight and stressful housing landscape.”

Inventory is down the most in San Jose, Las Vegas and Indianapolis. Home shoppers in San Jose will have 26 percent fewer homes to choose from than a year ago. In Las Vegas, inventory is down 23.5 percent, and among the homes on the market, almost 70 percent are high-end homes, among the most expensive on the market.

While inventory remains low, home value appreciation is soaring. The median home value in the U.S. rose 8 percent since last March to $213,146. Home values in San Jose, Las Vegas and Seattle are rising the fastest. The median home value in San Jose rose 25 percent over the past year to $1,252,424. In Las Vegas, home values rose 17 percent year-over-year, and 15 percent in Seattle.

Median rent across the nation rose 2.7 percent over the past year to a median payment of $1,447 per month. Sacramento, Calif., Riverside, Calif., and Seattle reported the greatest year-over-year rent appreciation among the 35 largest U.S. metros. In Sacramento, median rent rose 7.7 percent to $1,852. Median rent in Riverside and Seattle rose 7 percent and 4.7 percent, respectively.

March ended with mortgage rates on Zillow(ii) at 4.19 percent, the lowest rate of the month(iii). March mortgage rates peaked toward the end of the month at 4.30 percent, after starting the month at 4.20 percent. Zillow’s real-time mortgage rates are based on thousands of custom mortgage quotes submitted daily to anonymous borrowers on the Zillow Mortgages site and reflect the most recent changes in the market.

Chart

Zillow

Zillow is the leading real estate and rental marketplace dedicated to empowering consumers with data, inspiration and knowledge around the place they call home, and connecting them with the best local professionals who can help. In addition, Zillow operates an industry-leading economics and analytics bureau led by Zillow’s Chief Economist Dr. Svenja Gudell. Dr. Gudell and her team of economists and data analysts produce extensive housing data and research covering more than 450 markets at Zillow Real Estate Research. Zillow also sponsors the quarterly Zillow Home Price Expectations Survey, which asks more than 100 leading economists, real estate experts and investment and market strategists to predict the path of the Zillow Home Value Index over the next five years. Launched in 2006, Zillow is owned and operated by Zillow Group, Inc. (NASDAQ: Z and ZG), and headquartered in Seattle.

Zillow is a registered trademark of Zillow, Inc.

i. The Zillow Real Estate Market Reports are a monthly overview of the national and local real estate markets. The reports are compiled by Zillow Real Estate Research. For more information, visit www.zillow.com/research/. The data in Zillow’s Real Estate Market Reports are aggregated from public sources by a number of data providers for 928 metropolitan and micropolitan areas dating back to 1996. Mortgage and home loan data are typically recorded in each county and publicly available through a county recorder’s office. All current monthly data at the national, state, metro, city, ZIP code and neighborhood level can be accessed at www.zillow.com/local-info/ and www.zillow.com/research/data.

ii. Mortgage rates for a 30-year fixed mortgage.

iii. This rate was also hit on March 28th and 30th.

iv. The Zillow Home Value Index (ZHVI) is the median estimated home value for a given geographic area on a given day and includes the value of all single-family residences, condominiums and cooperatives, regardless of whether they sold within a given period. It is expressed in dollars, and seasonally adjusted.

v. The Zillow Rent Index (ZRI) is the median Rent Zestimate® (estimated monthly rental price) for a given geographic area on a given day, and includes the value of all single-family residences, condominiums, cooperatives and apartments in Zillow’s database, regardless of whether they are currently listed for rent. It is expressed in dollars.

Homebuyers Should Expect to Have Less Choice and Pay More This Spring

Tight inventory and rapid price gains could make finding a home harder

Columbus, OH – March 19, 2018 (PRNewswire) Finding a home to buy is getting more difficult according to the latest Nationwide Health of Housing Markets Report (HoHM Report). High demand and an ultra-low level of homes for sale is driving rapid price increases and – more importantly for prospective buyers – less time on the market.

Nationwide Logo

“As we head into spring and the traditional season when sales heat up, buyers will find that desirable homes won’t be on the market for long,” said David Berson, Nationwide senior vice president and chief economist. “Today, the average home is on the market almost half the length of time that it was six years ago. Of course, that is good news for people looking to sell their home.”

HoHM report data show that the average home was on the market – the time from listing to signing a contract – for 67 days in 2017. That time is cut in half in the nation’s hottest markets. The typical home in Denver or Colorado Springs, for instance, was only on the market for about 33-34 days in 2017.

Other notable markets with low averages are:

  • San Francisco-Redwood City, Calif. (35 days)
  • San Diego-Carlsbad, Calif. (37 days)
  • Portland, Ore. (38 days)
  • Dallas-Plano-Irving, Texas (40 days)
  • Kansas City (41 days)

“Average days on the market across the country are extraordinarily low, especially in certain hot markets,” said Berson. “When you factor in the nationwide trend of rapidly increasing prices, it’s going to be a more difficult market for homebuyers this year.”

National outlook remains positive

Despite rapid price growth and affordability concerns, Berson remains positive on the national housing market outlook.

“Household formations have offset much of the negative price impacts,” he said. “The labor market is strong, and wages are increasing. Affordability remains a concern, especially for entry-level homebuyers in today’s low-inventory conditions, but most indicators point to healthy, sustainable local markets with only a few extreme exceptions.”

Four of the top 10 metro areas in the index are in Pennsylvania, and two of the top three are in Illinois. In order, the top 10 are: Johnstown, Pa.; Carbondale-Marion, Ill.; Springfield, Ill.; Farmington, N.M.; New Bern, N.C.; Chambersburg-Waynesboro, Pa.; Pittsburgh, Pa.; Auburn-Opelika, Ala.; Harrisburg-Carlisle, Pa.; and, Erie, Pa.

Delinquency rates throughout Florida and along the gulf coast of Texas spiked in 2017 Q4, likely an aftereffect of hurricanes that hit both areas in 2017. Four Texas MSAs, including Houston, were in the bottom 10 markets.

In order, the bottom 10 are: Victoria, Texas; Rapid City, S.D.; Sherman-Denison, Texas; Beaumont-Port Arthur, Texas; Anchorage, Alaska; Houston-Sugar Land, Texas; Pueblo, Colo.; Brunswick, Ga.; Rochester, Minn.; and, Coeur d’Alene, Idaho.

More information about the HoHM Report, including the methodology used, can be found at blog.nationwide.com/housing. The HoHM Report is released on a quarterly basis online and in print.

About Nationwide
Nationwide, a Fortune 100 company based in Columbus, Ohio, is one of the largest and strongest diversified insurance and financial services organizations in the U.S. and is rated A+ by both A.M. Best and Standard & Poor’s. The company provides a full range of insurance and financial services, including auto, commercial, homeowners, farm and life insurance; public and private sector retirement plans, annuities and mutual funds; banking and mortgages; excess & surplus, specialty and surety; pet, motorcycle and boat insurance. For more information, visit www.nationwide.com.

Nationwide, Nationwide is on your side and the Nationwide N and Eagle are service marks of Nationwide Mutual Insurance Company.

Contact:

Ryan Ankrom
(614) 249-5145
ryan.ankrom@nationwide.com

Jordan Fisher
(312) 240-2951
jordan.fisher@edelman.com