LendingTree Releases Monthly Mortgage Offer Report for December

LendingTree’s Chief Economist analyzes December’s mortgage offers

Charlotte, NC – Jan. 9, 2019 (PRNewswire) LendingTree®, the nation’s leading online loan marketplace, today released its monthly Mortgage Offers Report, which analyzes data from actual loan terms offered to borrowers on LendingTree.com by lenders on LendingTree’s network. The purpose of the report is to empower consumers by providing additional information on how their credit profile affects their loan prospects.

Lendingtree Logo

  • December’s best mortgage offers for borrowers with the best profiles had an average APR of 4.35% for conforming 30-year, fixed-rate purchase loans, down from 4.66% in November. The APR on refinance loan offers also decreased from 4.63% in November to 4.34%. We consider people with the best credit profiles to be those in the 95th percentile of borrowers who received the best mortgage offers through the LendingTree marketplace, which allows users to compare offers from multiple mortgage lenders.
  • Mortgage rates vary depending upon parameters including credit score, loan-to-value ratio, income and property type.
    For the average borrower, the purchase APR for conforming 30-year, fixed-rate purchase loans offered on LendingTree’s platform was 5.17%, down 18 basis points from November. The loan note rate of 5.05% was down 19 basis points from November. We prefer to emphasize the APR as lenders often make changes to other fees in response to changing interest rates.
  • Consumers with the highest credit scores (760+, representing the 65th percentile of borrowers) received an average APR of 4.98%, versus 5.33% for consumers with scores of 680 to 719. The APR spread of 65 basis points between these score ranges is higher than it was in November. For the average purchase loan amount of $224,609, the spread represents over $17,000 in additional costs for borrowers with lower credit scores over 30 years. The additional costs result from higher interest rates, larger fees or a combination of the two.
  • For the average borrower, the APR for conforming 30-year, fixed-rate refinance loans decreased 24 basis points from November to 5.09%. At 4.93% and 5.21%, respectively, the spread between credit score brackets (760+ and 680-719) was 28 basis points. That amounts to nearly $13,000 in extra costs over the life of the loan for borrowers with lower credit scores, given an average refinance loan of $239,329.
  • Average proposed purchase down payments fell to $54,217, a decline of nearly $6,000.

Chart

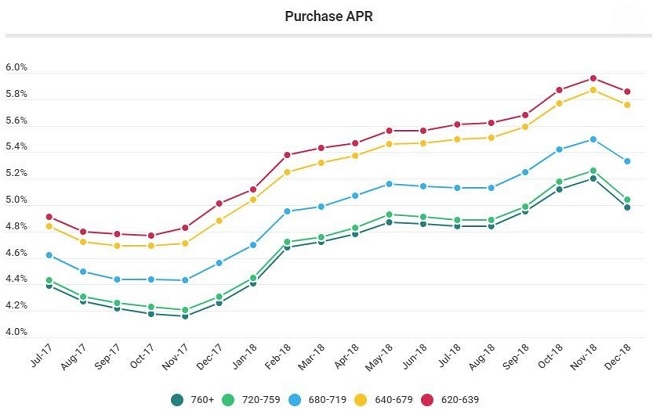
Purchase APR by Credit Score Range

Chart

* Lifetime interest paid is calculated based on the overall average loan amount to enable comparison.

Chart

*Lifetime interest paid is calculated based on the overall average loan amount to enable comparison.

To view the Mortgage Offers Report, visit: www.lendingtree.com.

LendingTree also released its weekly Mortgage Comparison Shopping Report, containing the Mortgage Rate Distribution and Mortgage Rate Competition Index. This week’s report found that 80.9 percent of purchase borrowers received mortgage rates under 5 percent last week. Homebuyers could have seen median lifetime savings of $30,377 in interest on a $300,000 loan by comparison shopping for the best mortgage rates.

About the Report

The LendingTree Mortgage Offers Report contains data from actual loan terms offered to borrowers on LendingTree.com by lenders. We believe it is an important addition to standard industry surveys and reports on mortgage rates. Most quoted industry rates are for a hypothetical borrower with prime credit who makes a 20% down payment. Most borrowers do not fit this profile. Our report includes the average quoted APR by credit score, together with the average down payment and other metrics described below. We stratify by credit score, so borrowers have added information on how their credit profile affects their loan prospects. The report covers conforming 30-yr fixed loans for both purchase and refinance.

  • APR: Actual APR offers to borrowers on our platform
  • Down Payment: Though analogous to the LTV, we find that borrowers identify more closely with the down payment. Academic studies have also found that the down payment is the primary concern for homebuyers and one of the main impediments to entering the homebuying market.
  • Loan Amount: The average loan amount borrowers are offered
  • LTV: Actual LTV offered to borrowers on our platform
  • Lifetime Interest Paid: This is the total cost a borrower incurs for the loan, inclusive of fees.

About LendingTree

LendingTree (NASDAQ: TREE) is the nation’s leading online marketplace that connects consumers with the choices they need to be confident in their financial decisions. LendingTree empowers consumers to shop for financial services the same way they would shop for airline tickets or hotel stays, comparing multiple offers from a nationwide network of over 500 partners in one simple search, and can choose the option that best fits their financial needs. Services include mortgage loans, mortgage refinances, auto loans, personal loans, business loans, student refinances, credit cards and more. Through the My LendingTree platform, consumers receive free credit scores, credit monitoring and recommendations to improve credit health. My LendingTree proactively compares consumers’ credit accounts against offers on our network, and notifies consumers when there is an opportunity to save money. In short, LendingTree’s purpose is to help simplify financial decisions for life’s meaningful moments through choice, education and support. LendingTree, LLC is a subsidiary of LendingTree, Inc. For more information, go to www.lendingtree.com, dial 800-555-TREE, like our Facebook page and/or follow us on Twitter @LendingTree.

Media Contact:

Megan Greuling
(704) 943-8208
Megan.greuling@lendingtree.com

CoreLogic Loan Performance Insights Find Delinquency Rates in October Dropped to the Lowest Level in at Least 18 Years

  • U.S. serious delinquency rate was the lowest since November 2006
  • Total past due and serious delinquency rates were down annually in October in all states except North Dakota, where the rates remained unchanged
  • Some hurricane-affected metros in the Carolinas and Florida Panhandle suffer jumps in key delinquency rates

Irvine, CA – January 8, 2019 (BUSINESS WIRE) CoreLogic® (NYSE: CLGX), a leading global property information, analytics and data-enabled solutions provider, today released its monthly Loan Performance Insights Report. The report shows that, nationally, 4.1 percent of mortgages were in some stage of delinquency (30 days or more past due, including those in foreclosure) in October 2018, representing a 1 percentage point decline in the overall delinquency rate compared with October 2017, when it was 5.1 percent. This was the lowest for the month of October in at least 18 years.

CoreLogic Logo

As of October 2018, the foreclosure inventory rate – which measures the share of mortgages in some stage of the foreclosure process – was 0.5 percent, down 0.1 percentage point since October 2017. The October 2018 foreclosure inventory rate tied with the April, May, June, July, August and September rates this year as the lowest for any month since September 2006 and also marked the lowest rate for an October since 2005. In both instances, the foreclosure inventory rate was 0.5 percent.

Measuring early-stage delinquency rates is important for analyzing the health of the mortgage market. To monitor mortgage performance comprehensively, CoreLogic examines all stages of delinquency, as well as transition rates, which indicate the percentage of mortgages moving from one stage of delinquency to the next.

The rate for early-stage delinquencies – defined as 30 to 59 days past due – was 1.9 percent in October 2018, down from 2.3 percent in October 2017. The share of mortgages that were 60 to 89 days past due in October 2018 was 0.7 percent, down from 0.9 percent in October 2017. The serious delinquency rate – defined as 90 days or more past due, including loans in foreclosure – was 1.5 percent in October 2018, down from 1.9 percent in October 2017. This serious delinquency rate was the lowest for an October since 2006 when it was 1.5 percent. It ties August and September 2018 as the lowest for any month since March 2007 when it was also 1.5 percent.

Chart 1

Chart 2

Chart 3

Since early-stage delinquencies can be volatile, CoreLogic also analyzes transition rates. The share of mortgages that transitioned from current to 30 days past due was 0.8 percent in October 2018, down from 1.1 percent in October 2017. By comparison, in January 2007, just before the start of the financial crisis, the current-to-30-day transition rate was 1.2 percent, while it peaked in November 2008 at 2 percent.

“While the strong economy has helped families stay current and push overall delinquency rates lower, areas that were hit hard by natural disasters have seen a rise in loan defaults,” said Dr. Frank Nothaft, chief economist for CoreLogic. “The 30-day delinquency rate in the Panama City, Florida metro area tripled between September and October 2018 as a result of Hurricane Michael. Two months after Hurricane Florence made landfall in the Carolinas, 60-day delinquency rates doubled in the Jacksonville, Wilmington, New Bern and Myrtle Beach metro areas. And buffeted by Kilauea’s eruption in the Hawaiian Islands, serious delinquency rates jumped on the Big Island by 9 percent between June and October 2018, while falling by 4 percent in the rest of Hawaii.”

Hurricane Irma and Hurricane Florence (2017 and 2018, respectively) continue to impact some metropolitan areas, with mortgages transitioning from current to 30 days past due. This October, 18 metropolitan areas posted an annual increase in overall delinquency rate, seven of which were either in North or South Carolina. In the coming months, CoreLogic will continue to monitor these and other metros struck by natural disaster for potential increase in delinquencies.

“Despite some regional spikes related to hurricane and fire impacted areas, overall delinquency rates are near or at historic lows,” said Frank Martell, president and CEO of CoreLogic.

For ongoing housing trends and data, visit the CoreLogic Insights Blog: www.corelogic.com/insights.

Methodology

The data in this report represents foreclosure and delinquency activity reported through October 2018.

The data in this report accounts for only first liens against a property and does not include secondary liens. The delinquency, transition and foreclosure rates are measured only against homes that have an outstanding mortgage. Homes without mortgage liens are not typically subject to foreclosure and are, therefore, excluded from the analysis. Approximately one-third of homes nationally are owned outright and do not have a mortgage. CoreLogic has approximately 85 percent coverage of U.S. foreclosure data.

Source: CoreLogic

The data provided is for use only by the primary recipient or the primary recipient’s publication or broadcast. This data may not be re-sold, republished or licensed to any other source, including publications and sources owned by the primary recipient’s parent company without prior written permission from CoreLogic. Any CoreLogic data used for publication or broadcast, in whole or in part, must be sourced as coming from CoreLogic, a data and analytics company. For use with broadcast or web content, the citation must directly accompany first reference of the data. If the data is illustrated with maps, charts, graphs or other visual elements, the CoreLogic logo must be included on screen or website. For questions, analysis or interpretation of the data, contact Alyson Austin at newsmedia@corelogic.com or Allyse Sanchez at corelogic@ink-co.com. Data provided may not be modified without the prior written permission of CoreLogic. Do not use the data in any unlawful manner. This data is compiled from public records, contributory databases and proprietary analytics, and its accuracy is dependent upon these sources.

About CoreLogic

CoreLogic (NYSE: CLGX) is a leading global property information, analytics and data-enabled solutions provider. The company’s combined data from public, contributory and proprietary sources includes over 4.5 billion records spanning more than 50 years, providing detailed coverage of property, mortgages and other encumbrances, consumer credit, tenancy, location, hazard risk and related performance information. The markets CoreLogic serves include real estate and mortgage finance, insurance, capital markets, and the public sector. CoreLogic delivers value to clients through unique data, analytics, workflow technology, advisory and managed services. Clients rely on CoreLogic to help identify and manage growth opportunities, improve performance and mitigate risk. Headquartered in Irvine, Calif., CoreLogic operates in North America, Western Europe and Asia Pacific. For more information, please visit www.corelogic.com.

CORELOGIC and the CoreLogic logo are trademarks of CoreLogic, Inc. and/or its subsidiaries.

Contacts

Media Contacts:
Alyson Austin
Corporate Communications
949-214-1414
newsmedia@corelogic.com

Allyse Sanchez
INK Communications
925-548-2535
corelogic@ink-co.com

Rising Mortgage Rates Take Big Bite out of Buyers’ Budgets

– A slowing housing market doesn’t mean it has suddenly become a good time for prospective home buyers as rising rates keep mortgage payments climbing.

– If rates reach 6 percent, the typical U.S. buyer will have $52,800 less to spend on a home.

– The brunt of rate increases is felt most sharply in pricey places like San Jose – where shoppers might soon be looking at homes $100,000 less expensive – Washington, D.C., and Boston. It most lightly hits pocketbooks in Miami and Tampa.

– Nearly 50,000 additional homes become unaffordable for a typical U.S. buyer purchasing at a 6 percent rate rather than the current rate.

Seattle, WA – Dec. 27, 2018 (PRNewswire) Home-value growth is slowing, price cuts are more common and for-sale inventory is up. Sounds like relief is imminent for home buyers, right? Not so fast. Mortgage rates have been steadily climbing for the past two years and could approach 6 percent by the end of 2019, dulling those factors.

Zillow Logo

Rising interest rates bite into buyers’ budgets more than they might think. For example, a buyer making the current U.S. median household income could have bought a $393,700 home in January 2018, spending 30 percent of that salary each month on a mortgage payment.i That’s when rates were at 4.15 percent. Now, with rates at 4.63 percent, that same buyer can only afford a $372,000 home to keep the monthly payment the same. If the mortgage rate hits 6 percent, that buyer will be shopping for a $319,200 home in order to maintain the budget, according to a Zillow® analysis. Home values have risen steadily this year, and continued appreciation – albeit more slowly – is expected at least through next year.

The result is that many home buyers in 2019 will need to reset their price points, with some making concessions about where they’re willing to live or how much space they want. Buyers being pushed toward less-expensive segments of the market where inventory is also the tightest could, in turn, push prices more quickly upward, making those homes less affordable. Right now, home shoppers wanting to spend no more than 30 percent of their median U.S. income can afford 56.5 percent of available homes. With rates at 6 percent, they would be looking among 48 percent of available homes – a loss of 49,660 potential homes.

The rise is felt more sharply in some metro areas than others. In San Jose, the nation’s most expensive metro, a 6 percent mortgage rate would have buyers making the $118,400 median household income looking at homes $102,100 less expensive than those they might be considering now. In Washington, D.C., they’d be looking at homes $87,200 less expensive. In each of the 35 largest metro areas in the U.S., the drop in buying power is at least $46,500.

Already, rising mortgage payments eclipse home-value gains, a phenomenon that can both encourage homeowners to stay put to hold onto low mortgage rates and discourage would-be first-time home buyers. What prospective home buyers should take away from all this is that there isn’t necessarily a “best time” to buy a home. Trying to time the housing market, like trying to time any market, is generally a bad idea.

“While it’s certainly important to keep track of home values and interest rates and plan your budget accordingly, buyers shouldn’t base their decisions on those moving targets. A home is the most valuable asset that most people will ever own, so it’s especially important not to gamble with it,” said Zillow senior economist Aaron Terrazas. “In the end, the best time to buy a home is always when the time is right for an individual buyer – often when they’re financially ready, when they’re relocating to a new area or a major life event requires them to upsize or downsize. It’s also important to remember that rates on a typical mortgage remain very low by historic standards – especially given the type of strong economic growth we’ve been experiencing.”

Although rising mortgage rates will affect home buyers first, renters will not be far behind. As higher rates limit the number of homes that potential buyers can afford, some would-be buyers will be too financially stretched to buy and will continue renting. As a result, rent growth is expected to tick upward.

Chart

Zillow

Zillow is the leading real estate and rental marketplace dedicated to empowering consumers with data, inspiration and knowledge around the place they call home, and connecting them with great real estate professionals. In addition, Zillow operates an industry-leading economics and analytics bureau led by Zillow Group’s Chief Economist Dr. Svenja Gudell. Dr. Gudell and her team of economists and data analysts produce extensive housing data and research covering more than 450 markets at Zillow Real Estate Research. Zillow also sponsors the quarterly Zillow Home Price Expectations Survey, which asks more than 100 leading economists, real estate experts and investment and market strategists to predict the path of the Zillow Home Value Index over the next five years. Launched in 2006, Zillow is owned and operated by Zillow Group, Inc. (NASDAQ: Z and ZG), and headquartered in Seattle.

Zillow is a registered trademark of Zillow, Inc.

(i) Presuming a 20 percent down payment and 30-year fixed mortgage.