LendingTree Releases Monthly Mortgage Offer Report for April

LendingTree’s Chief Economist analyzes April’s mortgage offers

Charlotte, NC – May 9, 2018 (PRNewswire) LendingTree®, the nation’s leading online loan marketplace, today released its monthly Mortgage Offers Report which analyzes data from actual loan terms offered to borrowers on LendingTree.com by lenders on LendingTree’s network. The purpose of the report is to empower consumers by providing additional information on how their credit profile affects their loan prospects.

lendingtree

  • April’s best offers for borrowers with excellent profiles had an average APR of 4.26% for conforming 30-year fixed purchase loans, up from 4.25% in March. Refinance loan offers were down 1 bps to 4.23%. Mortgage rates vary depending upon parameters including a borrower’s credit score, loan-to-value ratio, income and property type.
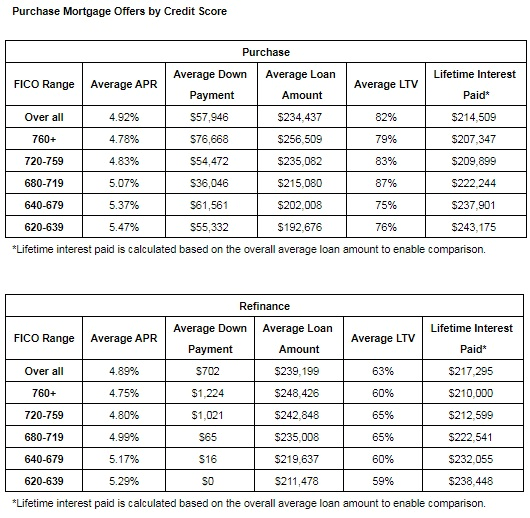
  • For the average borrower, purchase APRs for conforming 30-year fixed loans offered on LendingTree’s platform were up 7 bps to 4.92%. The loan note rate of 4.81% hit the highest since March 2016 and was up 6 bps from March 2018. We prefer to emphasize the APR as lenders often make changes to other fees in response to changing interest rates.
  • Consumers with the highest credit scores (760+) saw offered APRs of 4.78% in April, versus 5.07% for consumers with scores of 680-719. The APR spread of 29 bps between these score ranges was up 2 bps from March and the widest since this data series began in March 2016. The spread represents almost $15,000 in additional costs for borrowers with lower credit scores over 30 years for the average purchase loan amount of $234,437. The additional costs are due to higher interest rates, larger fees or a combination of the two.
  • Refinance APRs for conforming 30-year fixed loans were up 6 bps to 4.89%. The credit score bracket spread remained at 24 bps, amounting to nearly $13,000 in extra costs over the life of the loan for lower credit score borrowers given an average refinance loan of $239,199.
  • Average proposed purchase down payments were down nearly $5,000 from March at $57,946.

Chart

“We are in the core of the spring selling season for homes,” said Tendayi Kapfidze, LendingTree’s Chief Economist and report author. “Supply problems are dampening sales of existing homes and are particularly acute for lower-priced homes. Sales for homes under $100,000 were down 21% Y/Y in March, and those between $100,000 and $250,000 were down 8% Y/Y. Low inventory is the defining characteristic of the current housing market, and buyers should do all they can to position themselves competitively. We advise improving your credit score, getting financing in place ahead of the house hunt and shopping around for the best mortgage rates.”

Chart

About the Report

The LendingTree Mortgage Offers Report contains data from actual loan terms offered to borrowers on LendingTree.com by lenders. We believe it is an important addition to standard industry surveys and reports on mortgage rates. Most quoted industry rates are for a hypothetical borrower with prime credit who makes a 20% down payment. Most borrowers do not fit this profile. Our report includes the average quoted APR by credit score, together with the average down payment and other metrics described below. We stratify by credit score, so borrowers have added information on how their credit profile affects their loan prospects. The report covers conforming 30-yr fixed loans for both purchase and refinance.

  • APR: Actual APR offers to borrowers on our platform
  • Down Payment: Though analogous to the LTV, we find that borrowers identify more closely with the down payment. Academic studies have also found that the down payment is the primary concern for homebuyers and one of the main impediments to entering the homebuying market.
  • Loan Amount: The average loan amount borrowers are offered
  • LTV: Actual LTV offered to borrowers on our platform
  • Lifetime Interest Paid: This is the total cost a borrower incurs for the loan, inclusive of fees.

To view the original report, visit https://www.lendingtree.com/home/mortgage-offers-report-april-2018/.

About LendingTree:
LendingTree (NASDAQ: TREE) is the nation’s leading online loan marketplace, empowering consumers as they comparison-shop across a full suite of loan and credit-based offerings. LendingTree provides an online marketplace which connects consumers with multiple lenders that compete for their business, as well as an array of online tools and information to help consumers find the best loan. Since inception, LendingTree has facilitated more than 65 million loan requests. LendingTree provides free monthly credit scores through My LendingTree and access to its network of over 500 lenders offering home loans, personal loans, credit cards, student loans, business loans, home equity loans/lines of credit, auto loans and more. LendingTree, LLC is a subsidiary of LendingTree, Inc. For more information go to www.lendingtree.com, dial 800-555-TREE, like our Facebook page and/or follow us on Twitter @LendingTree.

Media Contact:
Megan Greuling
(704) 943-8208
Megan.greuling@lendingtree.com

Trulia Survey Finds Millennial Buyers Face Tough Decisions When Entering The Housing Market

Latest findings show 35% of 20-36 year olds who plan to purchase will do so in the next 12 months

San Francisco, CA – May 10, 2018 (PRNewswire) Today Trulia®, a home and neighborhood site that helps homebuyers and renters discover a place they’ll love to live, released the findings from its Consumer Home Buying Survey which suggests that market conditions and financial obstacles could be forcing millennial homebuyers to consider home and neighborhood trade-offs in order to purchase a home. The survey, conducted online by The Harris Poll of more than 2,000 Americans aged 18 and older, found that 84% of millennials (ages 20-36) say they’d be willing to give up one or more home features to live in their ideal neighborhood, if they were looking for a new home. Meanwhile 89% would be willing to give up one or more neighborhood features to live in their ideal home.

trulia-logo

Millennial Buyers Under Pressure Thanks to Rising Prices and Down Payment Savings
Of the 86% of millennials planning to purchase a home, 35% plan to purchase in the next year. However, rising home prices and shrinking inventory has created an environment where compromises are needed to be made. As the largest prospective home buying generation, almost all (98%) of millennials planning to buy in the next year have encountered obstacles that are keeping them from buying at this time. Unsurprisingly, financial concerns rank at the top of the list, with rising home prices as the most common culprit, affecting 40% of this population and saving enough for a down payment coming in second at 31%.

Chart

Generational Gap: Money Problems More Likely to Deter Millennial Buyers
Among those who ever planned to buy a home, millennials are the generation most likely to have had to put their home buying plans on hold at 90%, compared to 77% of Gen Xers (ages 37-53) and only 61% of baby boomers (ages 54-73). A look at generational differences in home buying obstacles sheds some light on difficulties that are uniquely skewed toward millennials including job instability (17%) and inability to pay off student debt (15%). Significantly less baby boomers have struggled with some of the biggest obstacles faced by millennials and Gen Xers – in fact, 39% have never had to put their home buying plans on hold.

Chart

Home Search Tradeoffs: Garages and Block Parties Top the List of Features to Forgo for Millennials
Perhaps due to tight budgets and fewer inventory, millennials are more willing than any other generation to consider trade-offs in their home and neighborhood. With 84% of millennials willing to give up a home feature to live in their ideal neighborhood and 89% willing to give up a neighborhood feature for their ideal home, older generations are less likely to be willing to compromise. About a third, 35%, of boomers and 22% of Gen Xers say they wouldn’t compromise on any home features for their ideal neighborhood while looking for a home, and 19% of boomers wouldn’t give up any neighborhood features for their ideal home. Garages are the number one feature to go when it comes to a new home feature for millennials, with 34% willing to give it up – compared to 22% of Gen Xers and 15% of baby boomers.

Chart

Similar to home trade-offs, 89% of millennials are willing to consider neighborhood concessions when searching for their ideal home, with 24% willing to accept higher crime rates, while only 15% of Baby Boomers said the same. However, all three generations agreed that neighborhood activities, such as clubs and block parties, would be the first feature that would get the axe during their home search (35%, 36%, and 42%, respectively).

Chart

Quotes from Trulia’s Senior Economist, Cheryl Young:

  • “For millennials, the dream of homeownership is alive and well, but with prices going up and inventory continuing to shrink, this new generation of buyers are facing more obstacles than any other demographic. With tight budgets and fewer choices on the market, most millennials are forced to make trade-offs and are more willing than other generations to give up home and neighborhood features in order to find their ideal home.”
  • “In markets where the economy and job growth are thriving, we may see some of these financial challenges start to dissipate as millennials mature into their careers. If anything, millennials can hold out hope that the encouraging housing starts we saw in 2017 can lead to some relief in the starter home segment.”

Methodology
This survey was conducted online within the United States by The Harris Poll on behalf of Trulia from April 10-12, 2018 among 2,026 U.S. adults ages 18 and older. This online survey is not based on a probability sample and therefore no estimate of theoretical sampling error can be calculated. For complete survey methodology, including weighting variables and subgroup sample sizes, please contact pr@trulia.com.

About Trulia
Trulia’s mission is to build a more neighborly world by helping you discover a place you’ll love to live. Homebuyers and renters use Trulia’s website and suite of mobile apps to get a deeper understanding of homes and neighborhoods across the U.S. through personalized recommendations, insights sourced straight from locals, and 34 different map overlays that offer details on commute, reported crime, schools, nearby businesses, and more. Founded in 2005, Trulia is based in San Francisco, and owned and operated by Zillow Group, Inc. (NASDAQ: Z and ZG). Trulia is a registered trademark of Trulia, LLC.

Media Contact:
Marcelo Vilela
pr@trulia.com
(415) 400-7228